Data
Introduction
The Data Node imports data from an external file.
This Node is typically used for the following:
- Overlaying dynamic simulation results from power systems software (e.g. PSS®E, PSCAD™) with real data from Hardware-In-the-Loop (HIL) testing or on-site commissioning.
- Plotting dynamic simulation results from power systems software which is not currently supported.
Currently, the Data Node supports importing data from .csv, .xls and .xlsx files.
User inputs
Select data
Input file name
Defines the input directory and file name of the external input file, including the file extension.
Example:
s52513_Qref_step_test__results.csv
Sheet
Optional. Defines the name of the sheet in the input file to import data from.
Example:
Sheet1
Input file range
Defines how x-axis (i.e. index) values are imported from the data. Options:
All: All x-axis (i.e. index) values are imported from the external input file (i.e. x-axis: Min [index] = 0 and x-axis: Max [index] = Max no. of rows in file).Defined range: A subset of x-axis (i.e. index) values are imported from the external input file. You must manually select values of x-axis: Min [index] and x-axis: Max [index].
x-axis: Min [index]
Defines the first x-axis (i.e. index) value imported from the external input file. Only appears if Import type is set to Defined range.
x-axis: Max [index]
Defines the last x-axis (i.e. index) value imported from the external input file. Only appears if Import type is set to Defined range.
Example: Import data from an external csv file which was generated by a PQM meter which had a sampling rate of 1 ms. The file was recording data for 30 seconds and therefore the csv file has 30,000 rows. However, you only want to import data from the last 10 seconds of this file.
20000;
30000;
Process data
X-axis shift
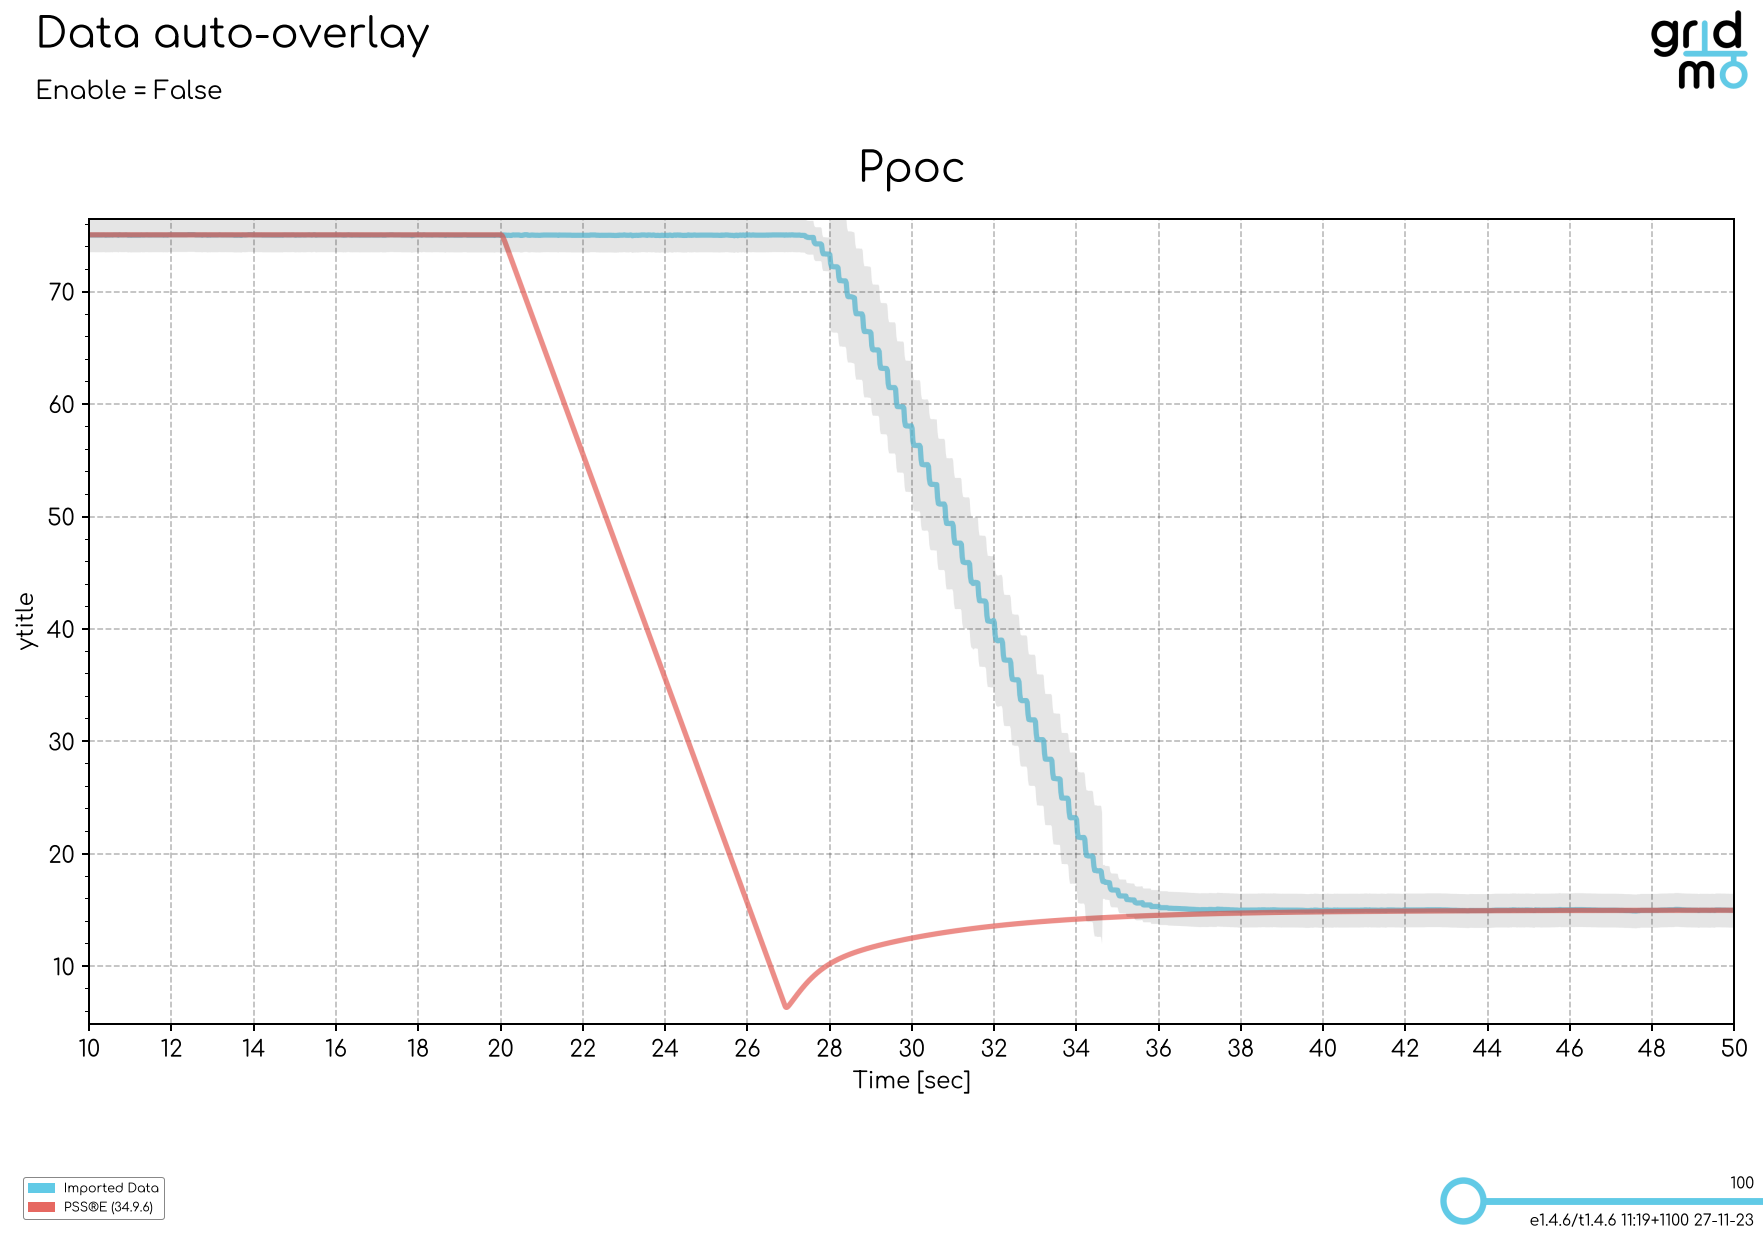
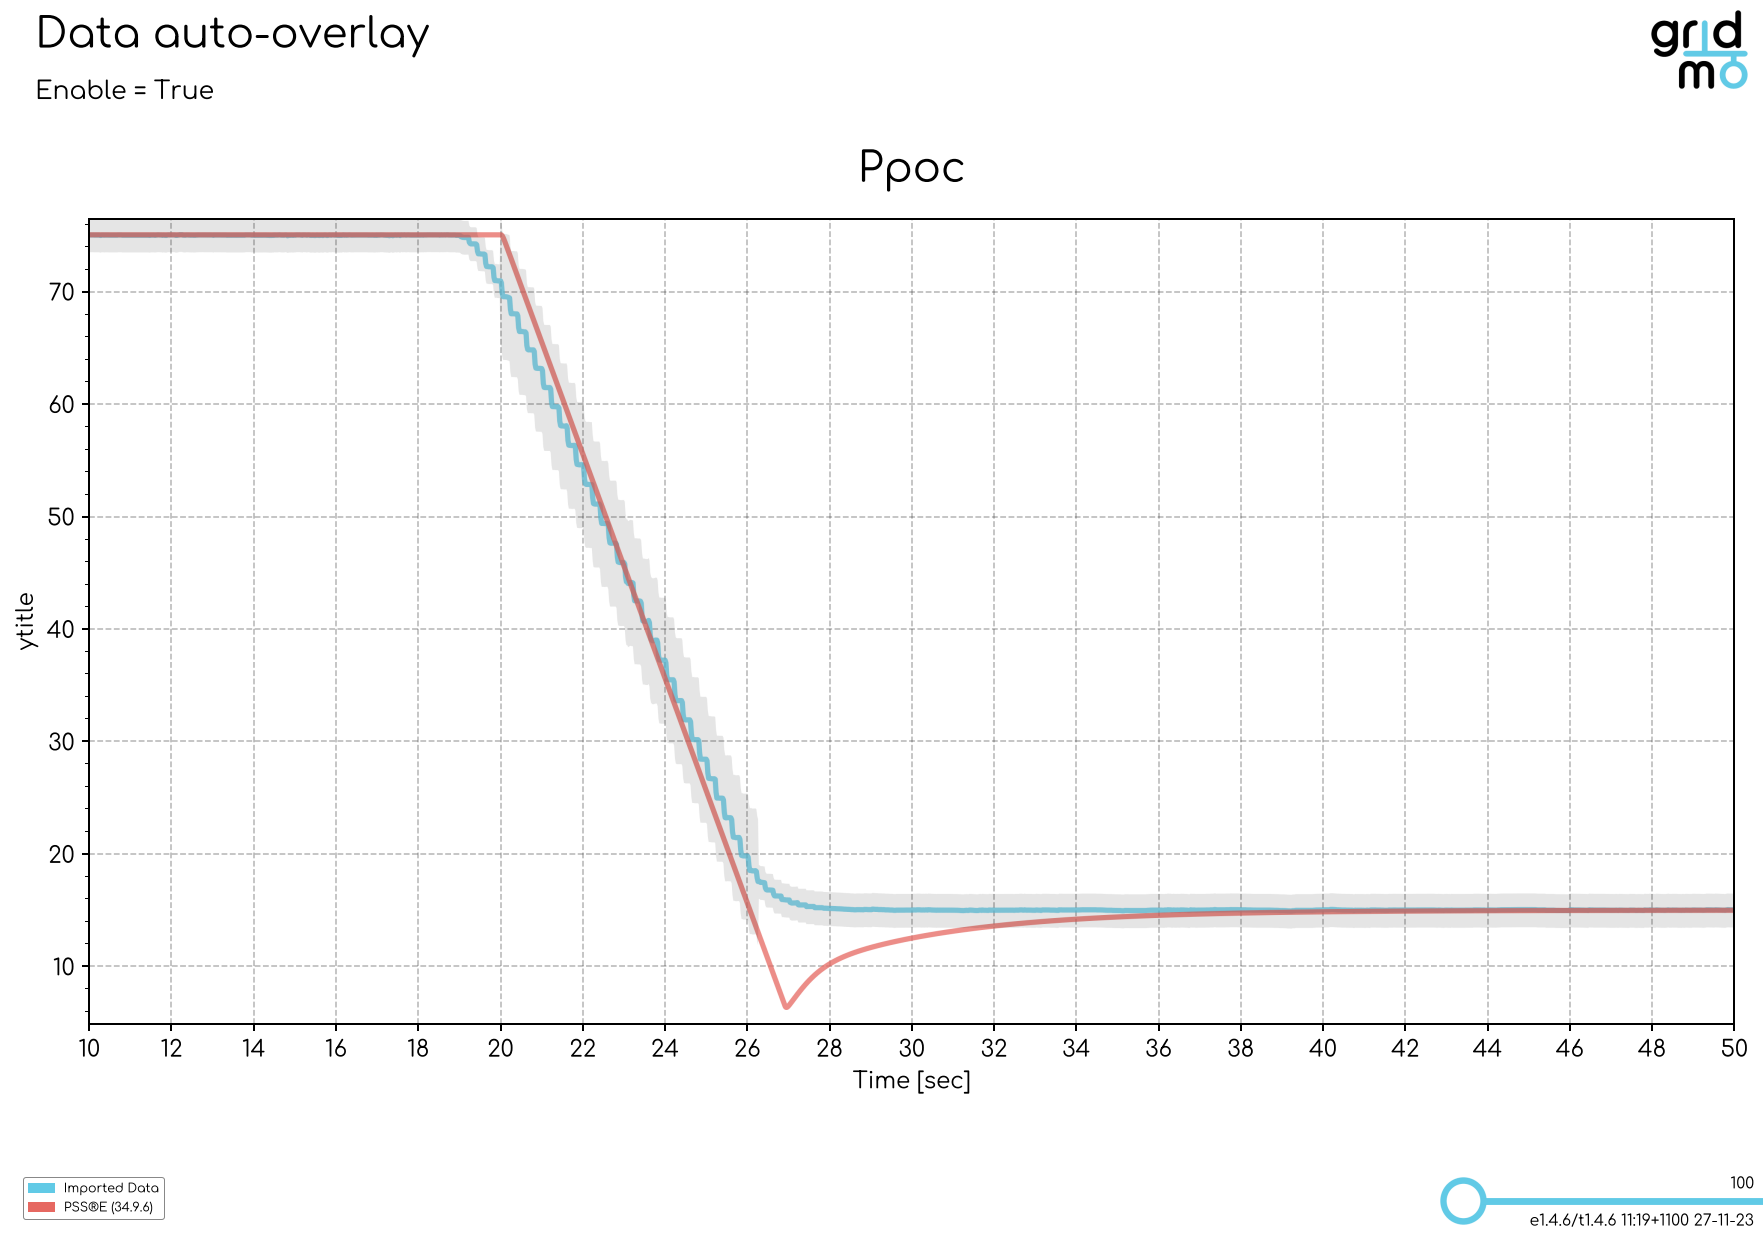
Auto align
The auto align feature automatically shifts the imported data in the x-axis direction, such that a single column of the imported data aligns with a single channel from a connected Node. This feature is typically used when overlaying dynamic simulation results from power systems software (e.g. PSS®E, PSCAD™) with real data from Hardware-In-the-Loop (HIL) testing or on-site commissioning.
The images below show an active power step with and without auto align enabled.
- Auto align disabled
- Auto align enabled
When using the auto align feature, we recommend aligning on the channel which had the biggest change over the dynamic simulation. For example:
- If you are simulating a fault, align on the voltage channel.
- If you are simulating active power step(s), align on the active power reference channel (if available) or otherwise use the active power output channel.
Column
Defines the name of the column from the external input file which is being used in the auto align feature.
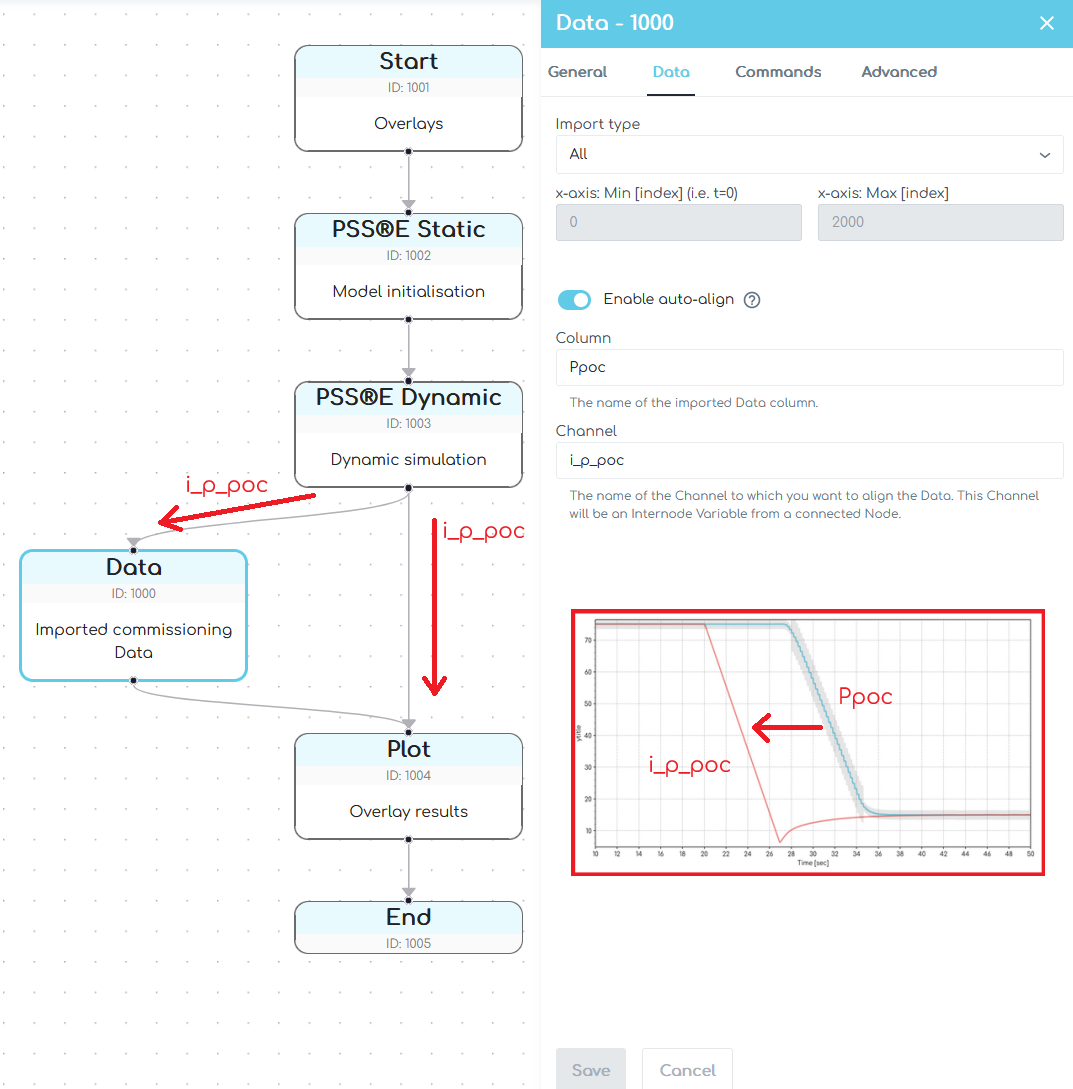
Channel
Defines the name of the Channel from a connected Node which is being used as the 'anchor' in the auto align feature. This Channel is often output from dynamic simulation results from power systems software (e.g. PSS®E, PSCAD™). The image below shows a typical Flow structure when using the auto-align feature.
Manual align
The manual align feature allows you to manually specify a row number in the input data file which corresponds with a time in time-series plots and power system simulations. This feature is typically used when overlaying dynamic simulation results from power systems software (e.g. PSS®E, PSCAD™) with real data from Hardware-In-the-Loop (HIL) testing or on-site commissioning.
Row number
The x-axis row number from the imported Data.
Time
The dynamic simulation time [seconds] at which you want to lock the x-axis index from the imported Data.
Actions
Defines the Commands which are applied to the imported data.
Supported Commands:
- PROCESS: Processes all values in a column of the imported data.
Define outputs
Outputs
Defines the outputs from the Data Node. The outputs defined here may be used later for plotting and/or further analysis.
Supported Commands:
- OUTPUT: Outputs a single value at a specified time or all values from a column as an Internode Variable.
- ADVOUTPUT: Outputs data from the specified column with advanced calculation features as an Internode Variable.
Outputs Description
Defines a short description of the data. This description will appear in the legend of any plot of the data originating from this Node.
Example:
Description here!

Advanced
Advanced Parameters
Advanced Parameters allow users to configure test details which are not commonly used. Advanced Parameters are often specific to each Node type.
Each line represents a new Advanced Parameter and is entered as a=b format, where a is the name of the Parameter and b is the corresponding value. All Advanced Parameters are set to their default values if they are not included in the Advanced Parameters field.
Example: Set Advanced Parameter, sample.parameter to a value of 5.
sample.parameter=5
API Reference
This section details the Commands and Advanced Parameters specific to the Node.
If a column name in the external input file contains spaces, reference this name by replacing the spaces with _. For example, if a column name in the external file is my Ppoc, set COL=my_Ppoc.
Actions
PROCESS | Process column
PROCESS, COL=, [VALSCALE=, VALOFFSET=, VAL_FUNCTION=]
Processes all values in a column of the imported data. All subsequent Commands will use the processed data. This feature is typically used when data in the external input file is not in the desired units (e.g. voltage is expressed in Volts, not p.u.).
Arguments:
- PROCESS
- COL (
str): Column name in the external input file. - VALSCALE 🔢 (
float)[Optional]: Multiplicative scale applied to the column values. scaled_value = (unscaled_value + VALOFFSET) × VALSCALE. Defaults to 1. - VALOFFSET 🔢 (
float)[Optional]: Additive value applied to the column values. scaled_value = (unscaled_value + VALOFFSET) × VALSCALE. Defaults to 0. - VAL_FUNCTION 🔢 (
str)[Optional]: Function applied to the column values. For example,VAL_FUNCTION=2*VAL+1. Cannot be used in conjunction withVALSCALEorVALOFFSET. Click here for more information on VAL_FUNCTION syntax and supported functions.
If your column names contain commas, dollar signs, or curly braces, you must remove them when you define the column name in the COL Argument. For example, if a column name in the external file is $Column, 1, you should set COL=Column 1.
Example: You have an external input file named my-real-data.csv. You wish to import active power from a column named P_POC in this file. However, the units in the external file are expressed in kW not MW, as you desire. Define the required Command to process this column of data.
PROCESS, COL=P_POC, VAL_FUNCTION=0.001*VAL
Outputs
OUTPUT | Output value(s)
OUTPUT, COL=, [CHANNEL_TYPE=, VALSCALE=, VALOFFSET=, VAL_FUNCTION=, AT=], NAME=, [PLOT_STYLE=SOLID, DISPLAY_ONLY=NO, LEGEND=]
Outputs all values from a column in the imported data. Use the AT= Argument to output a single value at a specified time [s], AT=SIM_START for the value at the first time step or AT=SIM_END for the value at the last time step.
Arguments:
OUTPUT
COL (
str): Column name in the external input file.CHANNEL_TYPE (
str)[Optional]: The type of output channel. Specifying the correct value for the output channel will result in more accurate auto-scaling for connectedPlotNodes. Options:CHANNEL_TYPE=PQS: Active power [MW], reactive power [MVAr] or apparent power [MVA].CHANNEL_TYPE=V: Voltage [p.u.].CHANNEL_TYPE=F: Frequency [Hz].CHANNEL_TYPE=ANGLE: Angle [degrees].CHANNEL_TYPE=I: Current [p.u.], active current [p.u.] or reactive current [p.u.]CHANNEL_TYPE=BINARY: Binary outputs, such as LVRT/HVRT trigger flags.CHANNEL_TYPE=TAPRATIO: Transformer tap ratios [p.u.].CHANNEL_TYPE=PF: Power factor [unitless].CHANNEL_TYPE=PU: Per unit [p.u.] (e.g. reference signals)
VALSCALE 🔢 (
float)[Optional]: Multiplicative scale applied to the output value(s). scaled_value = (unscaled_value + VALOFFSET) × VALSCALE. Defaults to 1.VALOFFSET 🔢 (
float)[Optional]: Additive value applied to the output value(s). scaled_value = (unscaled_value + VALOFFSET) × VALSCALE. Defaults to 0.VAL_FUNCTION 🔢 (
str)[Optional]: Function applied to the output value(s). For example,VAL_FUNCTION=2*VAL+1. Cannot be used in conjunction withVALSCALEorVALOFFSET. Click here for more information on VAL_FUNCTION syntax and supported functions.AT (
float)[Optional]: Time in the data [s] to extract a single value—the first sample at or after that time. IfAT=is omitted, the output is a time-series channel of values. Options:AT=x🔢 wherexis afloatAT=SIM_STARTAT=SIM_END
NAME (
str): Output name. Output names must be unique within a Node.PLOT_STYLE (
str)[Optional]: How this output channel should be plotted on connected Plot Nodes. Defaults toTYPE=SOLID. Options:TYPE=SOLID: A solid line.TYPE=DASHED: A dashed line.
DISPLAY_ONLY (
bool)[Optional]: IfYES, calculations (such asSETTLING_TIME) will not be performed using this output channel. Default value isNO.LEGEND (
str)[Optional]: Subplot legend name. Default value is no legend name.VAL(str)[Optional]: Deprecated. UseCHANNEL_TYPEinstead.
If your column names contain commas, dollar signs, or curly braces, you must remove them when you define the column name in the COL Argument. For example, if a column name in the external file is $Column, 1, you should set COL=Column 1.
Example: You have an external input file named my-real-data.csv. You wish to import all the time-series data from a column named P_POC in this file and later overlay this data with results from a PSS®E Dynamic simulation. The Internode Variable name should be i_real_data_Ppoc. Define the required output Command.
OUTPUT, COL=P_POC, NAME=i_real_data_Ppoc
Example: You have an external input file named my-real-data.csv. You wish to import the initial active power value from a column named P_POC in this file to initialize a PSS®E Static simulation. The Internode Variable name should be i_real_data_Ppoc_initial. Define the required output Command.
OUTPUT, COL=P_POC, NAME=i_real_data_Ppoc, AT=0
Example: You want a single Internode Variable with the last sample from P_POC (for example, to compare with a simulation value at the end of the run).
OUTPUT, COL=P_POC, NAME=i_real_data_Ppoc_end, AT=SIM_END
OUTPUT_PF | Output power factor
OUTPUT_PF, COL_P=, COL_Q=, [VALSCALE=, VALOFFSET=, VAL_FUNCTION=, PLOT_STYLE=SOLID, DISPLAY_ONLY=NO, LEGEND=], NAME=
Outputs a series of power factor values calculated from provided active and reactive power columns. Click here for details on how gridmo calculates power factor.
Arguments:
- OUTPUT_PF
- COL_P (
str): Active Power column name in the external input file. - COL_Q (
str): Reactive Power column name in the external input file. - VALSCALE 🔢 (
float)[Optional]: Multiplicative scale applied to the output value(s). scaled_value = (unscaled_value + VALOFFSET) × VALSCALE. Defaults to 1. - VALOFFSET 🔢 (
float)[Optional]: Additive value applied to the output value(s). scaled_value = (unscaled_value + VALOFFSET) × VALSCALE. Defaults to 0. - VAL_FUNCTION 🔢 (
str)[Optional]: Function applied to the output value(s). For example,VAL_FUNCTION=2*VAL+1. Cannot be used in conjunction withVALSCALEorVALOFFSET. Click here for more information on VAL_FUNCTION syntax and supported functions. - PLOT_STYLE (
str)[Optional]: How this output channel should be plotted on connected Plot Nodes. Defaults toTYPE=SOLID. Options:TYPE=SOLID: A solid line.TYPE=DASHED: A dashed line.
- DISPLAY_ONLY (
bool)[Optional]: IfYES, calculations (such asSETTLING_TIME) will not be performed using this output channel. Default value isNO. - LEGEND (
str)[Optional]: Subplot legend name. Default value is no legend name. - NAME (
str): Output name. Output names must be unique within a Node.
If your column names contain commas, dollar signs, or curly braces, you must remove them when you define the column name in the COL_P or COL_Q Argument. For example, if a column name in the external file is $Column, 1, you should set COL_P=Column 1.
Example: You have an external input file named my-real-data.csv. You wish to calculate the power factor from an active power column named P_POC and a reactive power column named Q_POC in this file. The Internode Variable name should be i_real_data_PF. Define the required output Command.
OUTPUT_PF, COL_P=P_POC, COL_Q=Q_POC, NAME=i_real_data_PF
OUTPUT_MEAN | Output mean
OUTPUT_MEAN, COL=, [COL=],[VALSCALE=, VALOFFSET=, VAL_FUNCTION=, PLOT_STYLE=SOLID, DISPLAY_ONLY=NO, LEGEND=], NAME=
Outputs a series of values calculated as the mean across one or more provided columns.
Arguments:
- OUTPUT_MEAN
- COL (
str): Column name in the external input file. - COL (
str)[Optional]: Additional column definitions. - VALSCALE 🔢 (
float)[Optional]: Multiplicative scale applied to the output value(s). scaled_value = (unscaled_value + VALOFFSET) × VALSCALE. Defaults to 1. - VALOFFSET 🔢 (
float)[Optional]: Additive value applied to the output value(s). scaled_value = (unscaled_value + VALOFFSET) × VALSCALE. Defaults to 0. - VAL_FUNCTION 🔢 (
str)[Optional]: Function applied to the output value(s). For example,VAL_FUNCTION=2*VAL+1. Cannot be used in conjunction withVALSCALEorVALOFFSET. Click here for more information on VAL_FUNCTION syntax and supported functions. - PLOT_STYLE (
str)[Optional]: How this output channel should be plotted on connected Plot Nodes. Defaults toTYPE=SOLID. Options:TYPE=SOLID: A solid line.TYPE=DASHED: A dashed line.
- DISPLAY_ONLY (
bool)[Optional]: IfYES, calculations (such asSETTLING_TIME) will not be performed using this output channel. Default value isNO. - LEGEND (
str)[Optional]: Subplot legend name. Default value is no legend name. - NAME (
str): Output name. Output names must be unique within a Node.
If your column names contain commas, dollar signs, or curly braces, you must remove them when you define the column name in the COL Argument. For example, if a column name in the external file is $Column, 1, you should set COL=Column 1.
Example: You have an external input file named my-real-data.csv. You wish to calculate the average of three voltage columns in this file. The Internode Variable name should be i_real_data_rms_voltage. Define the required output Command.
OUTPUT_MEAN, COL=V_POC_1, COL=V_POC_2, COL=V_POC_3, NAME=i_real_data_rms_voltage
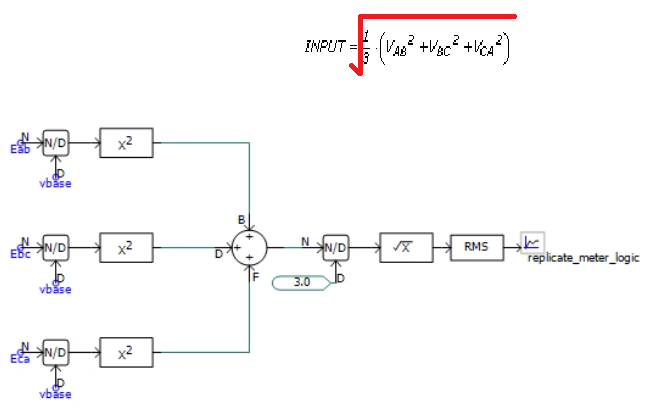
Converting 3-phase voltage signals into an equivalent 1-phase voltage signal
Measured site data will typically have 3 different voltage signals (i.e. Vab, Vbc and Vca). There are three different methods for using this voltage data in overlays. The first method is the simplest and utilizes the `OUTPUT_MEAN` Command. The second and third methods are more complicated and are not currently supported in gridmo - but may yield more accurate overlays in particular instances.
- 3ph -> 1ph (positive sequence): Calculating the mean of these three columns at each time step (i.e. (Vab + Vbc + Vca)/3) will give you the positive sequence voltage. For most applications, this simple calculation is most likely sufficient, especially when completing overlays with RMS power systems software like PSS®E because this single voltage signal value will be used to initialize a balanced Thévenin equivalent voltage source. The `OUTPUT_MEAN` Command can be used to complete this method.
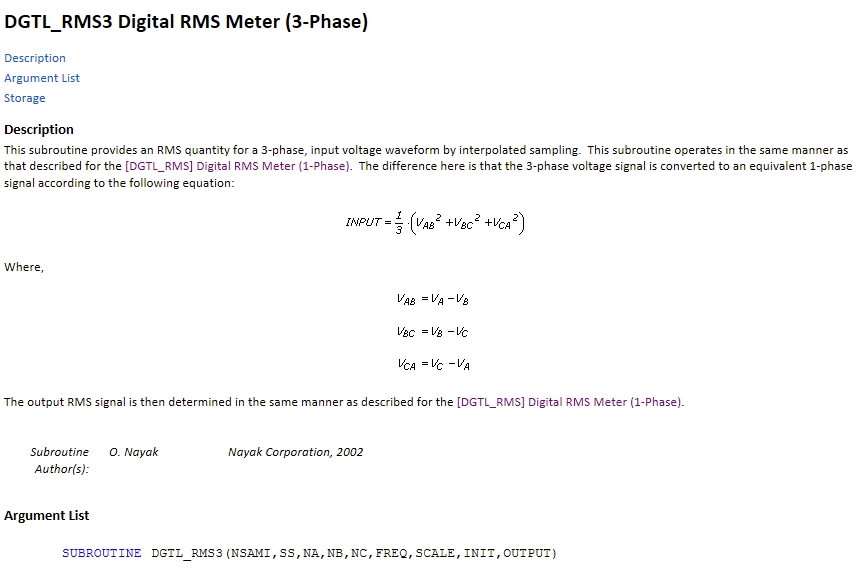
- 3ph -> 1ph: There are more complicated algorithms to determine the 1-phase equivalents of unbalanced 3-phase voltage signals. For example, the PSCAD™ component 'DGTL_RMS3 Digital RMS Meter (3-Phase)' details the following subroutine for this calculation:
- 3ph: It is also possible that all three voltage signals could be played back into software such as PSCAD™ without needing to create a 1-phase equivalent. This would involve creating capability for specifying individual phase voltages for Thévenin equivalent voltage source playback tests. We do not currently support this.
We could develop a new Command which applies this same algorithm to the three voltage signals ready to be overlaid with PSCAD™. We have not yet built such a feature. Additionally, we note that the documentation of the PSCAD™ component is actually incorrect. The image below shows the corrected formula and how the algorithm of the meter can be reproduced without using the 3-phase meter:
OUTPUT_FUNCTION Command
OUTPUT_FUNCTION, FUNCTION=, [CHANNEL_TYPE=, AT=], NAME=, [PLOT_STYLE=SOLID, DISPLAY_ONLY=NO, LEGEND=]
Use OUTPUT_FUNCTION when you want to create an output that combines other previously defined outputs within the same Node.
See Math operations for more information on the supported functions.
Arguments:
- OUTPUT_FUNCTION
- FUNCTION (
str): User-defined function. - CHANNEL_TYPE (
str)[Optional]: The type of output channel. Specifying the correct value for the output channel will result in more accurate auto-scaling for connectedPlotNodes. Options:CHANNEL_TYPE=PQS: Active power [MW], reactive power [MVAr] or apparent power [MVA].CHANNEL_TYPE=V: Voltage [p.u.].CHANNEL_TYPE=F: Frequency [Hz].CHANNEL_TYPE=ANGLE: Angle [degrees].CHANNEL_TYPE=I: Current [p.u.], active current [p.u.] or reactive current [p.u.]CHANNEL_TYPE=BINARY: Binary outputs, such as LVRT/HVRT trigger flags.CHANNEL_TYPE=TAPRATIO: Transformer tap ratios [p.u.].CHANNEL_TYPE=PF: Power factor [unitless]. Click here for details on how gridmo calculates power factor.CHANNEL_TYPE=PU: Per unit [p.u.] (e.g. reference signals)
- AT 🔢 (
float)[Optional]: Time in the data [s] to extract a single value—the first sample at or after that time. IfAT=is omitted, the output is a time-series channel of values. Options:AT=x🔢 wherexis afloatAT=SIM_STARTAT=SIM_END
- NAME (
str): Output name. Output names must be unique within a Node. - PLOT_STYLE (
str)[Optional]: How this output channel should be plotted on connected Plot Nodes. Defaults toTYPE=SOLID. Options:TYPE=SOLID: A solid line.TYPE=DASHED: A dashed line.
- DISPLAY_ONLY (
bool)[Optional]: IfYES, calculations (such asSETTLING_TIME) will not be performed using this output channel. Default value isNO. - LEGEND (
str)[Optional]: Subplot legend name. Default value is no legend name.
Example: Calculate the sum of the active power from two lines and name the output i_p_line_sum.
OUTPUT, COL=P_LINE1, NAME=i_p_line1
OUTPUT, COL=P_LINE2, NAME=i_p_line2

OUTPUT_FUNCTION, FUNCTION={{i_p_line1}}+{{i_p_line2}}, NAME=i_p_line_sum
ADVOUTPUT | Advanced output
ADVOUTPUT, COL=, OP=, START_T=, [END_T=∞, VALSCALE=, VAL_FUNCTION=], NAME=
Outputs data from the specified column with advanced calculation features.
Arguments:
- ADVOUTPUT
- COL (
str): Column name in the external input file. - OP (
str): Operation used in the calculation. Options:OP=SUBTRACT: OutputCOLUMN(END_T) - COLUMN(START_T).OP=ADD: OutputCOLUMN(END_T) + COLUMN(START_T).OP=MULTIPLY: OutputCOLUMN(END_T) * COLUMN(START_T).OP=DIVIDE: OutputCOLUMN(END_T) / COLUMN(START_T).OP=MIN: Output the minimum of the column betweenSTART_TandEND_T.OP=MAX: Output the maximum of the column betweenSTART_TandEND_T.OP=MEDIAN: Output the median of the column betweenSTART_TandEND_T.OP=MEAN: Output the mean of the column betweenSTART_TtoEND_T.OP=DELTA: Output the difference between the maximum and minimum of the column betweenSTART_TandEND_T.OP=OVERSHOOT%: Outputs the overshoot percentage. This is the maximum normalized absolute value of the column betweenSTART_TtoEND_Tdivided by the normalized value atEND_T
- START_T 🔢 (
float): Start output calculation from this time [seconds]. - END_T 🔢 (
float)[Optional]: End output calculation at this time [seconds]. Defaults to the end of the column data. - VALSCALE 🔢 (
float)[Optional]: Multiplicative scaling factor applied to the output value (i.e. scaled_value = unscaled_value xVALSCALE). Default value is 1. - VAL_FUNCTION 🔢 (
str)[Optional]: Function applied to the output value(s). For example,VAL_FUNCTION=2*VAL+1. Cannot be used in conjunction withVALSCALEorVALOFFSET. Click here for more information on VAL_FUNCTION syntax and supported functions. - NAME (
str): Output the calculated value to an Internode Variable. Output names must be unique within a Node.
If your column names contain commas, dollar signs, or curly braces, you must remove them when you define the column name in the COL Argument. For example, if a column name in the external file is $Column, 1, you should set COL=Column 1.
Example: Export the average of the first 5 seconds of a loaded data column called Vpoc 3ph RMS [kV] and convert the resulting value into per unit on a 220 kV base. Name this value i_v_initial
ADVOUTPUT, COL=Vpoc 3ph RMS [kV], OP=MEAN, START_T=0, END_T=5, VAL_FUNCTION=VAL/220, NAME=i_v_initial
Advanced Parameters
Each Advanced Parameter is entered on its own line as name=value.
Example: Enable high resolution alignment and disable the experimental alignment algorithm.
high.resolution.align=Yes
experimental.alignment.algorithm=No
high.resolution.align
- Description: Only applicable if auto align enabled. If
Yes, switches to a higher resolution alignment algorithm which is much slower but can produce better alignment between the imported data and the connected Node's source channel. IfNo(default), a lower resolution alignment algorithm is used which is much faster, but may not align as well. - Type:
str - Units: N/A
- Default: No
- Range: N/A
high.resolution.align=value
experimental.alignment.algorithm
- Description: Only applicable if auto align enabled. If
Yes, switches to a new alignment algorithm which is still in development. This new algorithm will attempt to align as much data as possible by penalizing extrapolation, thereby producing better benchmarking alignment than the default algorithm under certain circumstances. IfNo(default), the gridmo default alignment algorithm is used. - Type:
bool - Units: N/A
- Default: No
- Range: Yes, No
experimental.alignment.algorithm=value