Table
Introduction
The Table Node outputs values from connected Nodes to a spreadsheet format.
This Node is typically used for the following:
- Outputting network values (e.g. line loading) from a PSS®E Static Node to include in a static study report.
- Outputting calculated values (e.g. settling time) from a Plot Node.
Currently, the Table Node only supports comma-separated values (csv) output files.
User inputs
Define table
Output file name
Defines the output directory and file name of the table, including the .csv file extension.
Example:
s5255_q_settling_time_results.csv
Each Table Node represents a single output file. Output file names within a simulation must be unique.
As a result, Loop Variables and Internode Variables are not supported in the Output file name field.
Data
Defines the data to be exported into the output file.
Enter a name for the column header, and the value that should be populated in that column. If the Table Node is located inside a loop, each loop represents a new row in the output file.
Example: Create an output file with the following table.
| ACTIVE_POWER | VOLTAGE_AT_BUS1 | VOLTAGE_AT_BUS2 | TRANSFORMER_LOAD |
|---|---|---|---|
| 50 | 1.03 | 1.04 | 64% |
| 100 | 1.05 | 1.06 | 82% |
| ... | ... | ... | ... |
Within the Table Node:
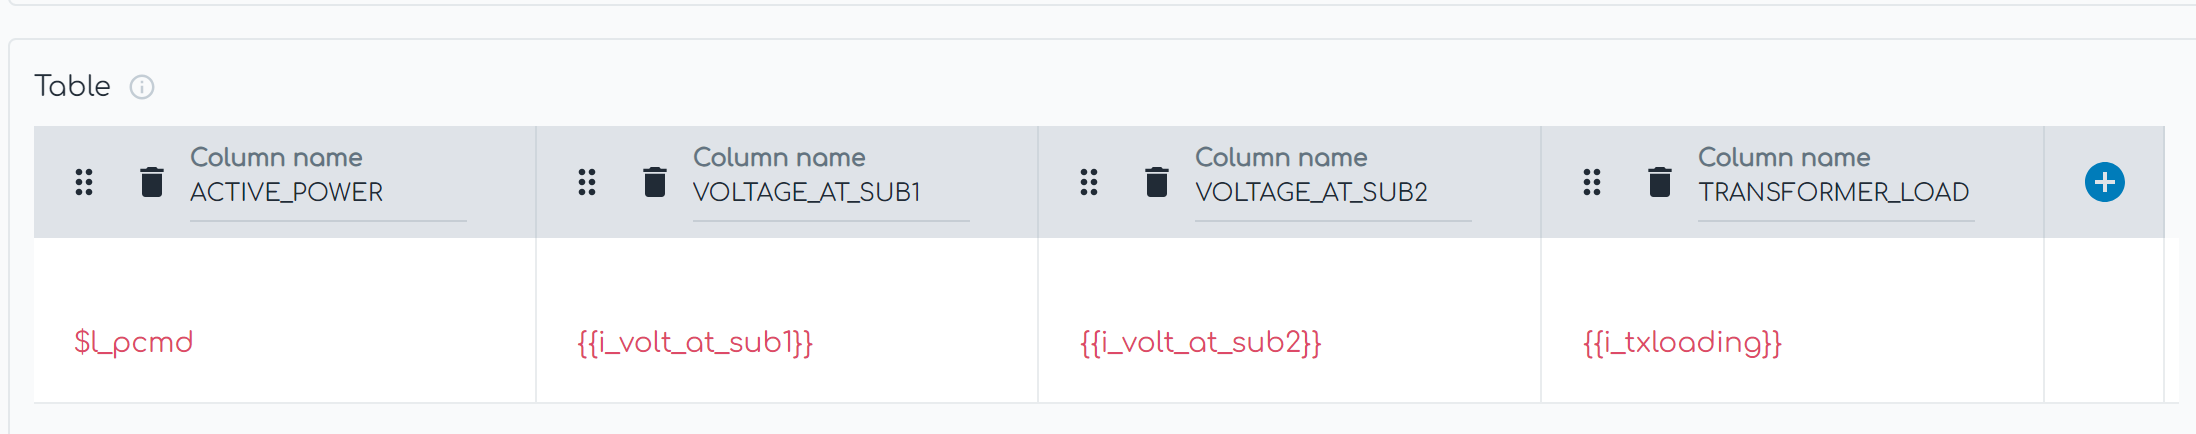
The example above assumes that $l_pcmd is a Loop Variable and {{i_volt_at_sub1}}, {{i_volt_at_sub2}} and {{i_txloading}} are Internode Variables from a connected Node.
Calculations
It is possible to perform mathematical calculations in the Table Node. For a full list of supported operators and functions, see Math operations.
Supported syntax
| Category | Syntax | Notes |
|---|---|---|
| Arithmetic | +, -, *, / | Standard operator precedence applies. Use () to group expressions. |
| Exponentiation | ** | For example, {{i_p_poc}}**2 |
| Comparisons | ==, !=, <, <=, >, >= | Can be chained, for example -0.1 < {{i_vpoc_delta}} < 0.1 |
| Logical | and, or, not | Combine multiple conditions in an if expression |
| Conditional | <value_if_true> if <condition> else <value_if_false> | |
| Constants | nan, inf, pi | |
| Functions | abs, min, max, sqrt, sin, cos, tan, asin, acos, atan, deg2rad, rad2deg, log, log10, sign | Case-insensitive (ABS, MAX, and so on also work). min and max accept multiple arguments. |
For each cell in the Data Table, all Internode Values must come from the same source.
It is not possible to have a calculation as follows (where each value comes from a different source):
{{i_only_from_node1000}} + {{i_only_from_node1001}}
However, gridmo will automatically handle the following (where each value comes from the same source). This will generate two output columns in the table, one for Node 1000 results and a second for Node 1001 results.
{{i_from_node1000_and_1001}} + {{i_from_node1000_and_1001}}
Special behaviour
nanvalues still appear in the output table, but scatter plots sourced from this Table Node skip them. Useelse nanin a conditional expression to omit rows that do not meet your test criteria.
Examples
Arithmetic
Find the ratio between positive sequence Iq and negative sequence Iq, assuming the two Internode Variables are exported from a connected Node.
{{i_ch_pos_seq_iq}} / {{i_ch_neg_seq_iq}}
Convert a rise time from seconds to milliseconds.
{{i_iqpoc_rise_time}}*1000
Conditional expressions (if / else)
Use a conditional expression to include a value only when a condition is met. The general form is:
<calculation_or_value> if <condition> else <alternative_value>
If the number of edges in an FRT signal (from a COUNT_EDGES command in a connected Plot Node) is greater than 0, output i_delta_poc_iq; otherwise output nan so the point is omitted from scatter plots.
{{i_delta_poc_iq}} if {{count_edges}} > 0 else nan
Output a value only when it falls within a specific range; otherwise output 0.
{{i_val_1}} if 10 < {{i_val_2}} <= 20 else 0
Output a rise time in milliseconds only when the voltage change is near zero (within ±0.1 p.u.); otherwise output nan.
({{i_iqpoc_rise_time}}*1000) if -0.1 < {{i_vpoc_delta}} < 0.1 else nan
Comparison and logical operators
Combine conditions with and / or:
{{i_poc_p}} if {{count_edges}} > 0 and {{i_vpoc_min}} < 0.9 else nan
Built-in functions
Clamp a value between a minimum and maximum.
max({{i_q_min}}, min({{i_q_max}}, {{i_q_measured}}))
Calculate the magnitude of a phasor from real and imaginary components.
sqrt({{i_p_real}}**2 + {{i_p_imag}}**2)
Convert an angle from degrees to radians before applying a trigonometric function.
sin(deg2rad({{i_angle_deg}}))
Advanced
Advanced Parameters
Advanced Parameters allow users to configure test details which are not commonly used. Advanced Parameters are often specific to each Node type.
Each line represents a new Advanced Parameter and is entered as a=b format, where a is the name of the Parameter and b is the corresponding value. All Advanced Parameters are set to their default values if they are not included in the Advanced Parameters field.
Example: Set Advanced Parameter, sample.parameter to a value of 5.
sample.parameter=5
API Reference
This section details the Commands and Advanced Parameters specific to the Node.
Advanced Parameters
Each Advanced Parameter is entered on its own line as name=value.
Example: Sort the table by the third column (col.sort.index=2) in descending order.
col.sort.index=2
col.sort.ascending=No
col.sort.index
- Description: Specifies how the table should be sorted. If equal to -1 (default), the Node sorts automatically based on the order defined in the connected
Start loopNode(s). If set to a valuen, sorts in ascending order by the nth column in the table (zero indexed, e.g. ifn=2, this means sort by the 3rd column from the left). - Type: int
- Units: N/A
- Default: -1
- Range: -1 or 0 - N (where N = number of columns in table)
col.sort.index=value
col.sort.ascending
- Description: If
Yes, sort by the column defined incol.sort.indexfrom smallest value to largest value. IfNo, sort by the column defined incol.sort.indexfrom largest value to smallest value. - Type: bool
- Units: N/A
- Default: Yes
- Range: Yes/No
col.sort.ascending=value