Importing real-world data
Background
In this first part of the data benchmarking series, we will show you how to import real-world data (in .csv format) into the gridmo platform, so you can use it to overlay with dynamic study results.
In this part, we will:
- Import real-world data from a generating system into the gridmo platform.
- Plot the real-world data.
You can download the complete example project file used in this series from the below link. The example data file and the models required to run this example simulation are packaged with the gridmo Engine - no further configuration is required.
This multi-part example assumes you have a basic understanding of the gridmo platform. If you are new to gridmo, please see the Getting started guide.
Example
1) Add the data you want to import into your Engine's Inputs folder
In gridmo, you can import generic time-series data by using the Data Node.
Place the data file in the Inputs folder of your gridmo Engine (including subfolders as desired) and paste the relative file path to the inputs folder in the Data Node's Input file name field, such as gridmo\data\e002_q_step_data.csv.
Currently, only .csv files are currently supported by the Data Node.
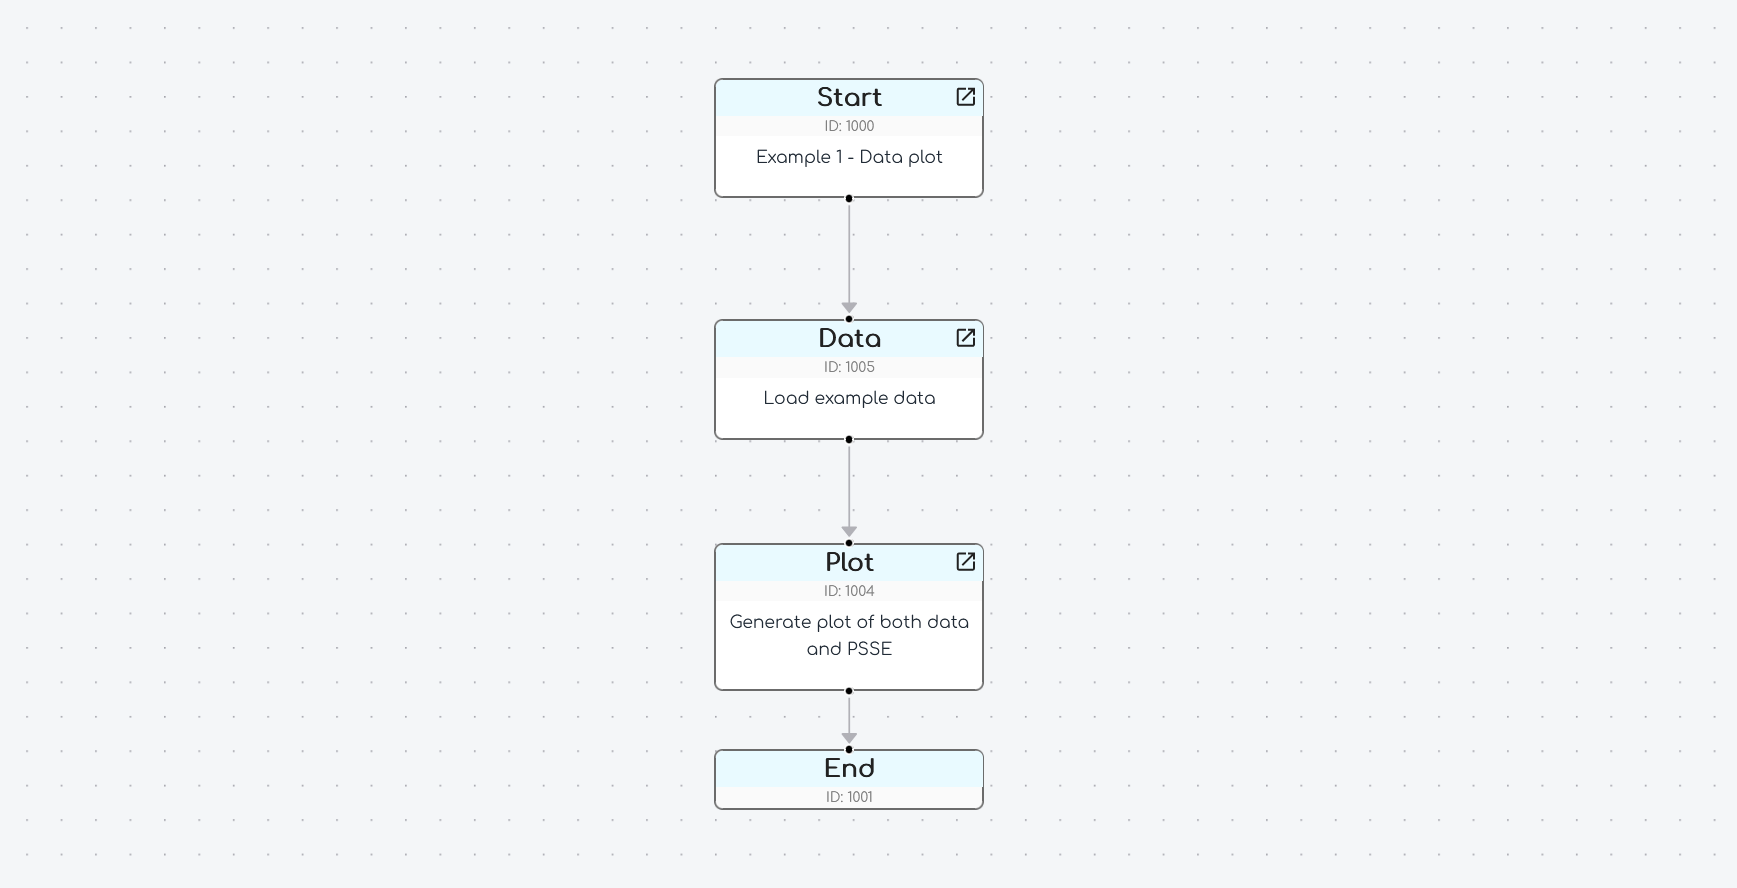
2) Create a new gridmo Project and add the following Nodes
StartNodeDataNodePlotNodeEndNode
And connect the Nodes together as shown below.
3) Configure the Data Node
- Double click on the
DataNode to open the configuration window. - Set the
Input file nameto the relative path of the.csvfile you want to import, such asgridmo\data\e002_q_step_data.csv. - Switch to the
Define outputstab. - Add the following
OUTPUTcommands to convert the columns in the.csvfile to Internode Variables for use in gridmo.
// Convert from CSV column names into Internode Variables
OUTPUT, COL=V_pu, NAME=i_ch_poc_v
OUTPUT, COL=P_MW, NAME=i_ch_poc_p
OUTPUT, COL=Q_MVAr, NAME=i_ch_poc_q
The above commands convert each column from the name in the .csv file to an Internode Variable for use in gridmo. Specifically:
- The column
V_pucan be accessed by Nodes connected to thisDataNode usingi_ch_poc_v - The column
P_MWcan be accessed by Nodes connected to thisDataNode usingi_ch_poc_p - The column
Q_MVArcan be accessed by Nodes connected to thisDataNode usingi_ch_poc_q
If your .csv file is using a different unit than the unit you want for your simulation, you can use the optional argument VALSCALE= to apply a multiplicative scale.
You do not need to directly modify the source .csv file.
For example, if you .csv data file has voltage in kV (with a 33 kV base) you can use the following command:
OUTPUT, COL=V_at_33kV, NAME=i_ch_poc_v, VALSCALE=1/33
4) Configure the Plot Node
- Double click on the
PlotNode to open the configuration window. - Set the
Plot typetoPDFto output a PDF file. - Enter an output file name, such as
Data example import. - Enter a plot title, such as
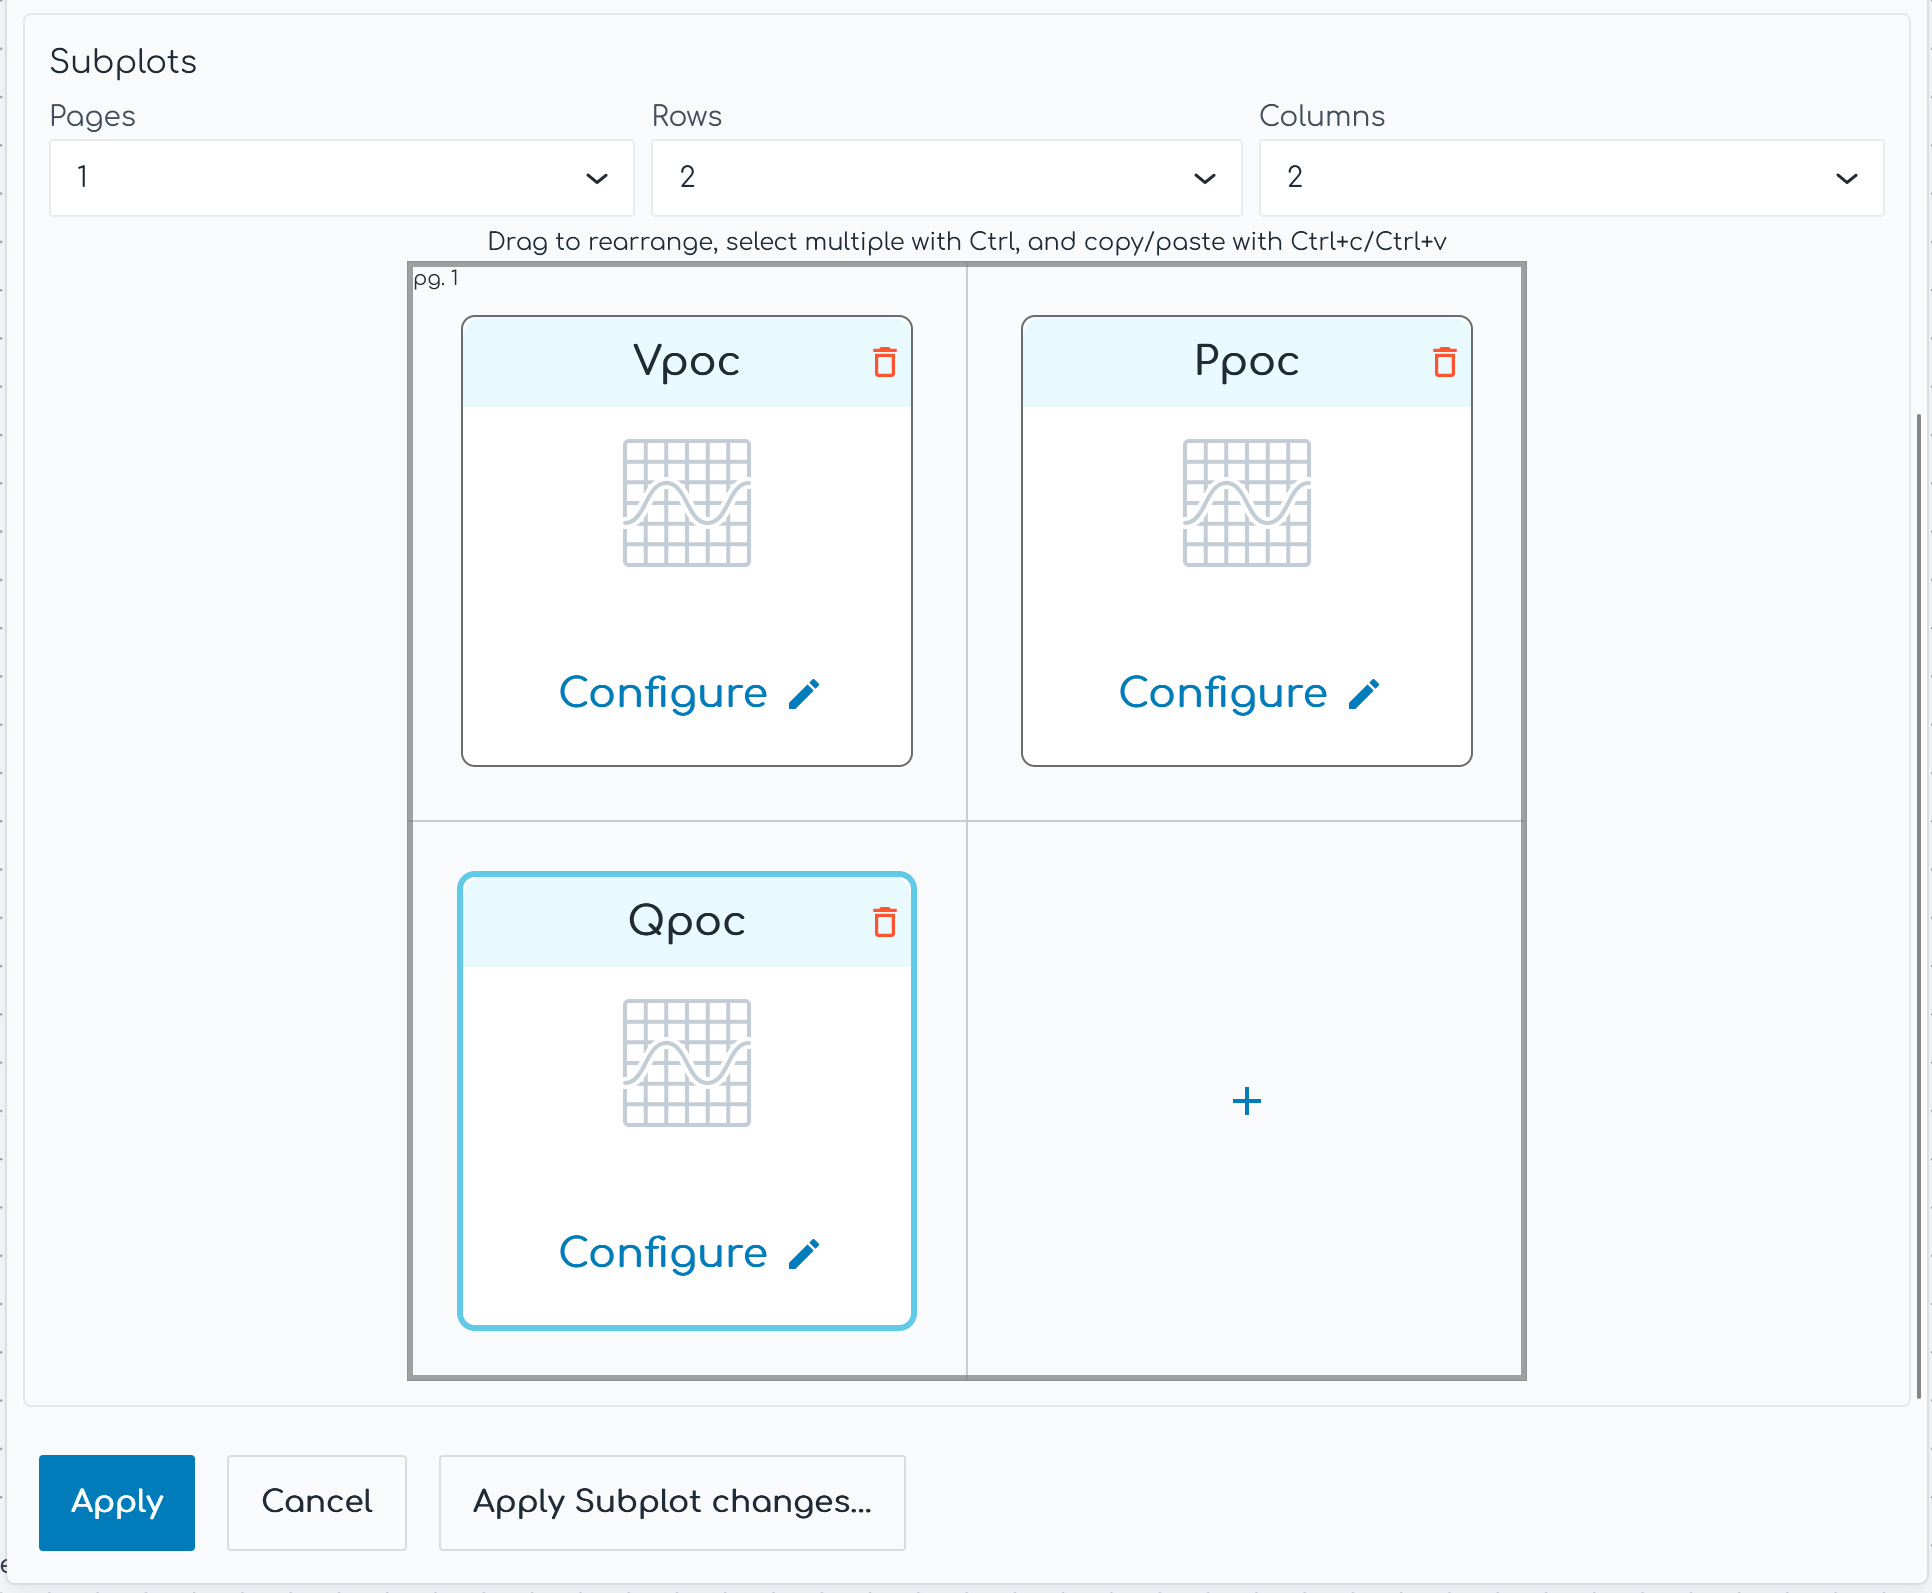
Imported real-world data into gridmo. - In the
Define Subplotstab:- Set the x-axis minimum
3and maximum to10 - Under
Subplotsselect1page,2rows and3columns. - Click on the
+to add a new subplot. For each subplot:- Enter a title in
Subplot title, such asVpoc. - Under
y-axis Channelsenter each of the Internode Variables with the double curly brackets, such as{{i_ch_poc_v}}
- Enter a title in
- Set the x-axis minimum
5) Launch the simulation
- Launch the simulation
- The output plot should show the real-world data you imported plotted as per your configuration of the
PlotNode.
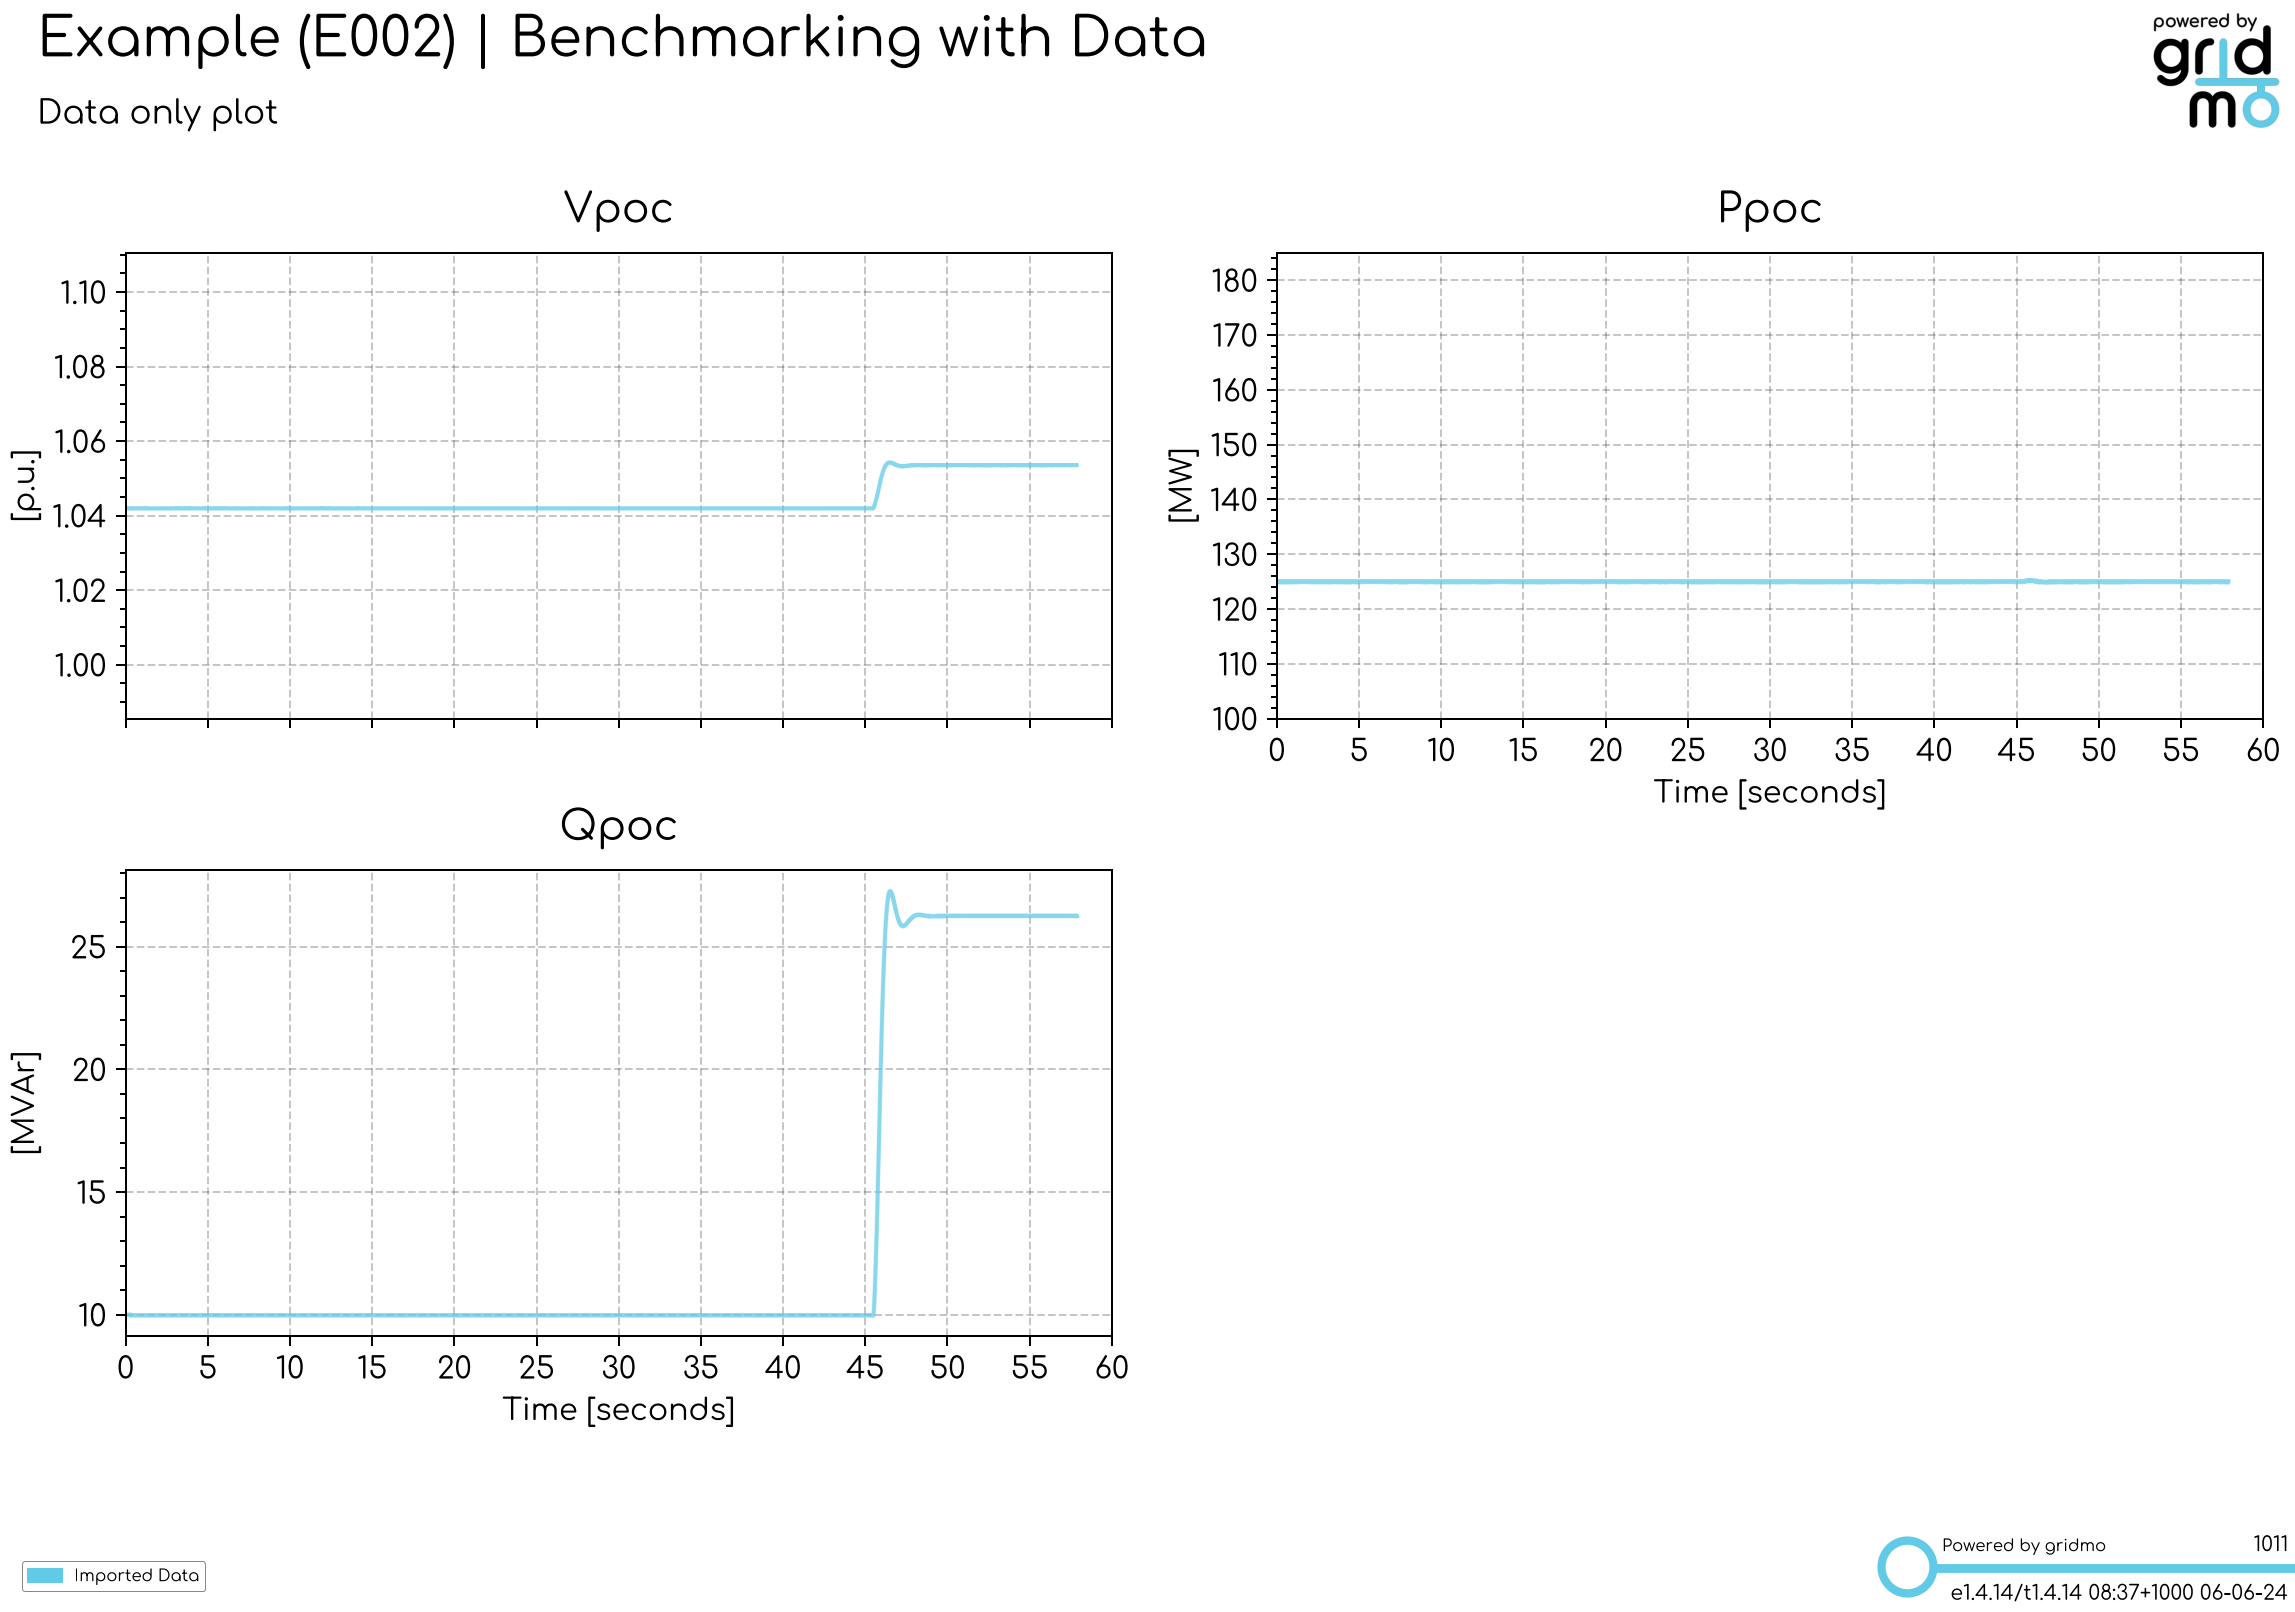
6) Review the results
- We can see in our outputs folder (example below) that we have plotted the real-world data:
- ✅ Point of connection voltage, active power and reactive power are all plotted.
- ✅ We can see in our data that the test being recorded appears to be a single reactive power step.
Next step
In the next step, we will overlay the real-world data we added in this step with the results of a dynamic study.