How to initialize dynamic studies from static study results
Background
This example explains how and why you could use a static study result to initialize a dynamic study using the gridmo platform. Below you can also find a step-by-step tutorial and a downloadable example you can run on your Engine.
Why initialize from static study results?
Generator interconnection studies are increasingly being completed using multiple power systems software packages, where the results from each package must be benchmarked. It can be difficult to ensure accurate benchmarking across different software packages. One approach to improve the alignment of the dynamic results between packages is to initialize the dynamic studies using the results from a common static study.
For example, you may have a complex generating system with multiple tap changers, switched reactive plant (harmonic filters, SVCs etc) and want to use the result of a static study completed in PSS®E or PowerFactory to initialize a dynamic study in a different software package, such as PSCAD™.
Common values exported from static static study results
The following values are commonly exported from static study results and used to initialize dynamic studies:
- Plant statuses:
- Tap positions of any on-load tap changers (see
OUTPUT, VAL=TAPRATIO). - Step positions or status of any switched reactive plant (e.g. SVCs, switched caps, harmonic filters).
- Tap positions of any on-load tap changers (see
- static study results:
- Voltage magnitude at a bus, typically the infinite or reference bus for the generating system (see
OUTPUT, VAL=V). - Voltage angle at a bus, typically the infinite or reference bus for the generating system (see
OUTPUT, VAL=ANGLE).
- Voltage magnitude at a bus, typically the infinite or reference bus for the generating system (see
- Generating system target values:
- Power factor target on a line, typically the line connecting the generating system to the grid (see
OUTPUT, VAL=PF). - Voltage droop target on a line/bus, typically the line connecting the generating system to the grid (see
OUTPUT, VAL=VDROOPTARGET).
- Power factor target on a line, typically the line connecting the generating system to the grid (see
You can download the complete example project file used in this tutorial from the below link. This downloadable example uses a PSS®E Static Node (or optionally a PowerFactory Static Node) to calculate a static study and export the voltage magnitude at the infinite bus. This result is then imported into PSCAD™ as the initial conditions for a dynamic study of a solar farm. The result is benchmarked with a PSS®E Dynamic result (and/or optionally a PowerFactory Dynamic) result. The models required to run this simulation are packaged with the gridmo Engine - no further configuration is required.
Simple generating systems (those with simple tap changer controls and no dynamic/switched reactive plant) may not require initialisation from a static simulation at all.
Specifically, if you only require infinite bus voltage to be calculated to achieve a desired point of connection (POC) voltage, you can use the following Commands to turn on smiby's automatic infinite bus voltage calculation function in the PSCAD™ Node's Commands field - removing the need for a static simulation to calculate the infinite bus voltage altogether.
SET, CNAME=smiby, PARAM=auto_vinf_enabled, VAL=1 //1 to enable, 0 to switch to manual vinf mode
SET, CNAME=smiby, PARAM=auto_vinf_poc_v, VAL=PUT_POC_V_DESIRED_IN_PU
SET, CNAME=smiby, PARAM=auto_vinf_poc_p, VAL=PUT_POC_V_DESIRED_IN_MW
SET, CNAME=smiby, PARAM=auto_vinf_poc_q, VAL=PUT_POC_V_DESIRED_IN_MVAR
Example
In the following worked example, we are going to configure a PSS®E static simulation to export the voltage magnitude at the infinite bus. We will then use this value to initialize a PSCAD™ simulation of a solar farm.
The following example assumes you have a basic understanding of the gridmo platform. If you are new to gridmo, please see the Getting started guide.
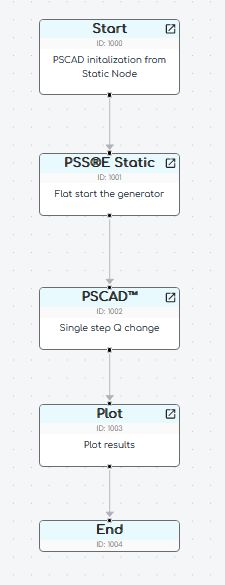
1) Start a new gridmo Project and add the following Nodes
StartNodePSS®E StaticNode (orPowerFactory StaticNode)PSCAD™NodePlotNodeEndNode
2) Connect the Nodes as per below
3) Configure the PSS®E Static Node
- Double click on the
PSS®E StaticNode to open the configuration window. - Set the
Modeltogridmo\wecc-solar\psse\solar.savto use an example 175 MW solar farm's PSS®E case file. - Select the
Define simulation & Define outputstab. - Under the
Commandsfield, add the following Commands:
SET, LINE=1000->999#1, STATUS=IN, SCR=7.5, XR=4
CONTROL, GEN=999#1, Q=VDIRECT, ATBUS=1000, VTARGET=1.00, QMIN=-9999, QMAX=9999
CONTROL, GEN=91003#S1, ATLINE=1001->1000#1, P=175
CONTROL, GEN=91003#S1, ATLINE=1001->1000#1, Q=FIXED, QTARGET=0
SOLVE
OUTPUT, BUS=999, VAL=V, NAME=i_v_at_inf
- The above Commands:
- Set the SCR and X/R ratio for this example SMIB model to
7.5and4respectively. - It then controls the example solar farm to achieve P=175 MW, Q=0 MVAr at the solar farm's connection point.
- It also uses the infinite bus generator to achieve
1.00pu voltage at the connection point. - Finally, it outputs the voltage magnitude at the infinite bus and assigns the name
i_v_at_infinside the gridmo simulation. This is creating an Internode Variable.
- Set the SCR and X/R ratio for this example SMIB model to
4) Configure the PSCAD™ Node
- Double click on the
PSCAD™Node to open the configuration window. - Set the
Workspacetogridmo\wecc-solar\pscad\wecc_solar_wspace.pswxto use the same solar farm's PSCAD™ workspace file. - Select the
Define simulationtab. - Set the
Simulation time [seconds]to10seconds. - Under the
Actionsfield add the following actions
CONTROL, CH=SCR, AT=0, VAL=7.5
CONTROL, CH=XR, AT=0, VAL=4
SET, CNAME=smiby, PARAM=vinf, VAL={{i_v_at_inf}}
CONTROL, AT=0, CH=1, VAL=1
CONTROL, AT=0, CH=2, VAL=0
CONTROL, AT=5, CH=2, VAL=0.1
The above Commands:
- Set the SCR and X/R ratio for this example SMIB model to
7.5and4respectively. - Set the parameter called
vinf(which is the initial voltage magnitude at the infinite bus) to the value ofi_v_at_infwhich comes from thePSS®E StaticNode (an Internode Variable). - Sets channel 1 (which is connected to the solar farm's active power control) to
1per unit (meaning maximum power e.g. 175 MW) and channel 2 (which is connected to the solar farm's reactive power control) to0per unit (meaning0MVAr). Note these values could also be exported from the static simulation using anOUTPUT, LINE=..., VAL=..., NAME=...Command. - Finally, we make a change in the reactive power control channel 2 at 5 seconds to
0.1per unit (e.g. 17.5 MVAr).
5) Configure the PSCAD™ output channels
- Add the following output channels to the
PSCAD™Node
OUTPUT, TITLE=smiby_POC_VOLT, VAL=V, NAME=i_ch_poc_v
OUTPUT, TITLE=smiby_POC_P, VAL=PQS, NAME=i_ch_poc_p
OUTPUT, TITLE=smiby_POC_Q, VAL=PQS, NAME=i_ch_poc_q
The above Commands:
- Output the voltage magnitude at the point of connection (POC) to the grid and assign the name
i_ch_poc_v - Output the active power at the POC and assign the name
i_ch_poc_p - Output the reactive power at the POC and assign the name
i_ch_poc_q
6) Configure the Plot Node
- Double click on the
PlotNode to open the configuration window. - Set the
Plot typetoPDFto output a PDF file. - Enter an output file name, such as
PSSE to PSCAD initialisation - Enter a plot title, such as
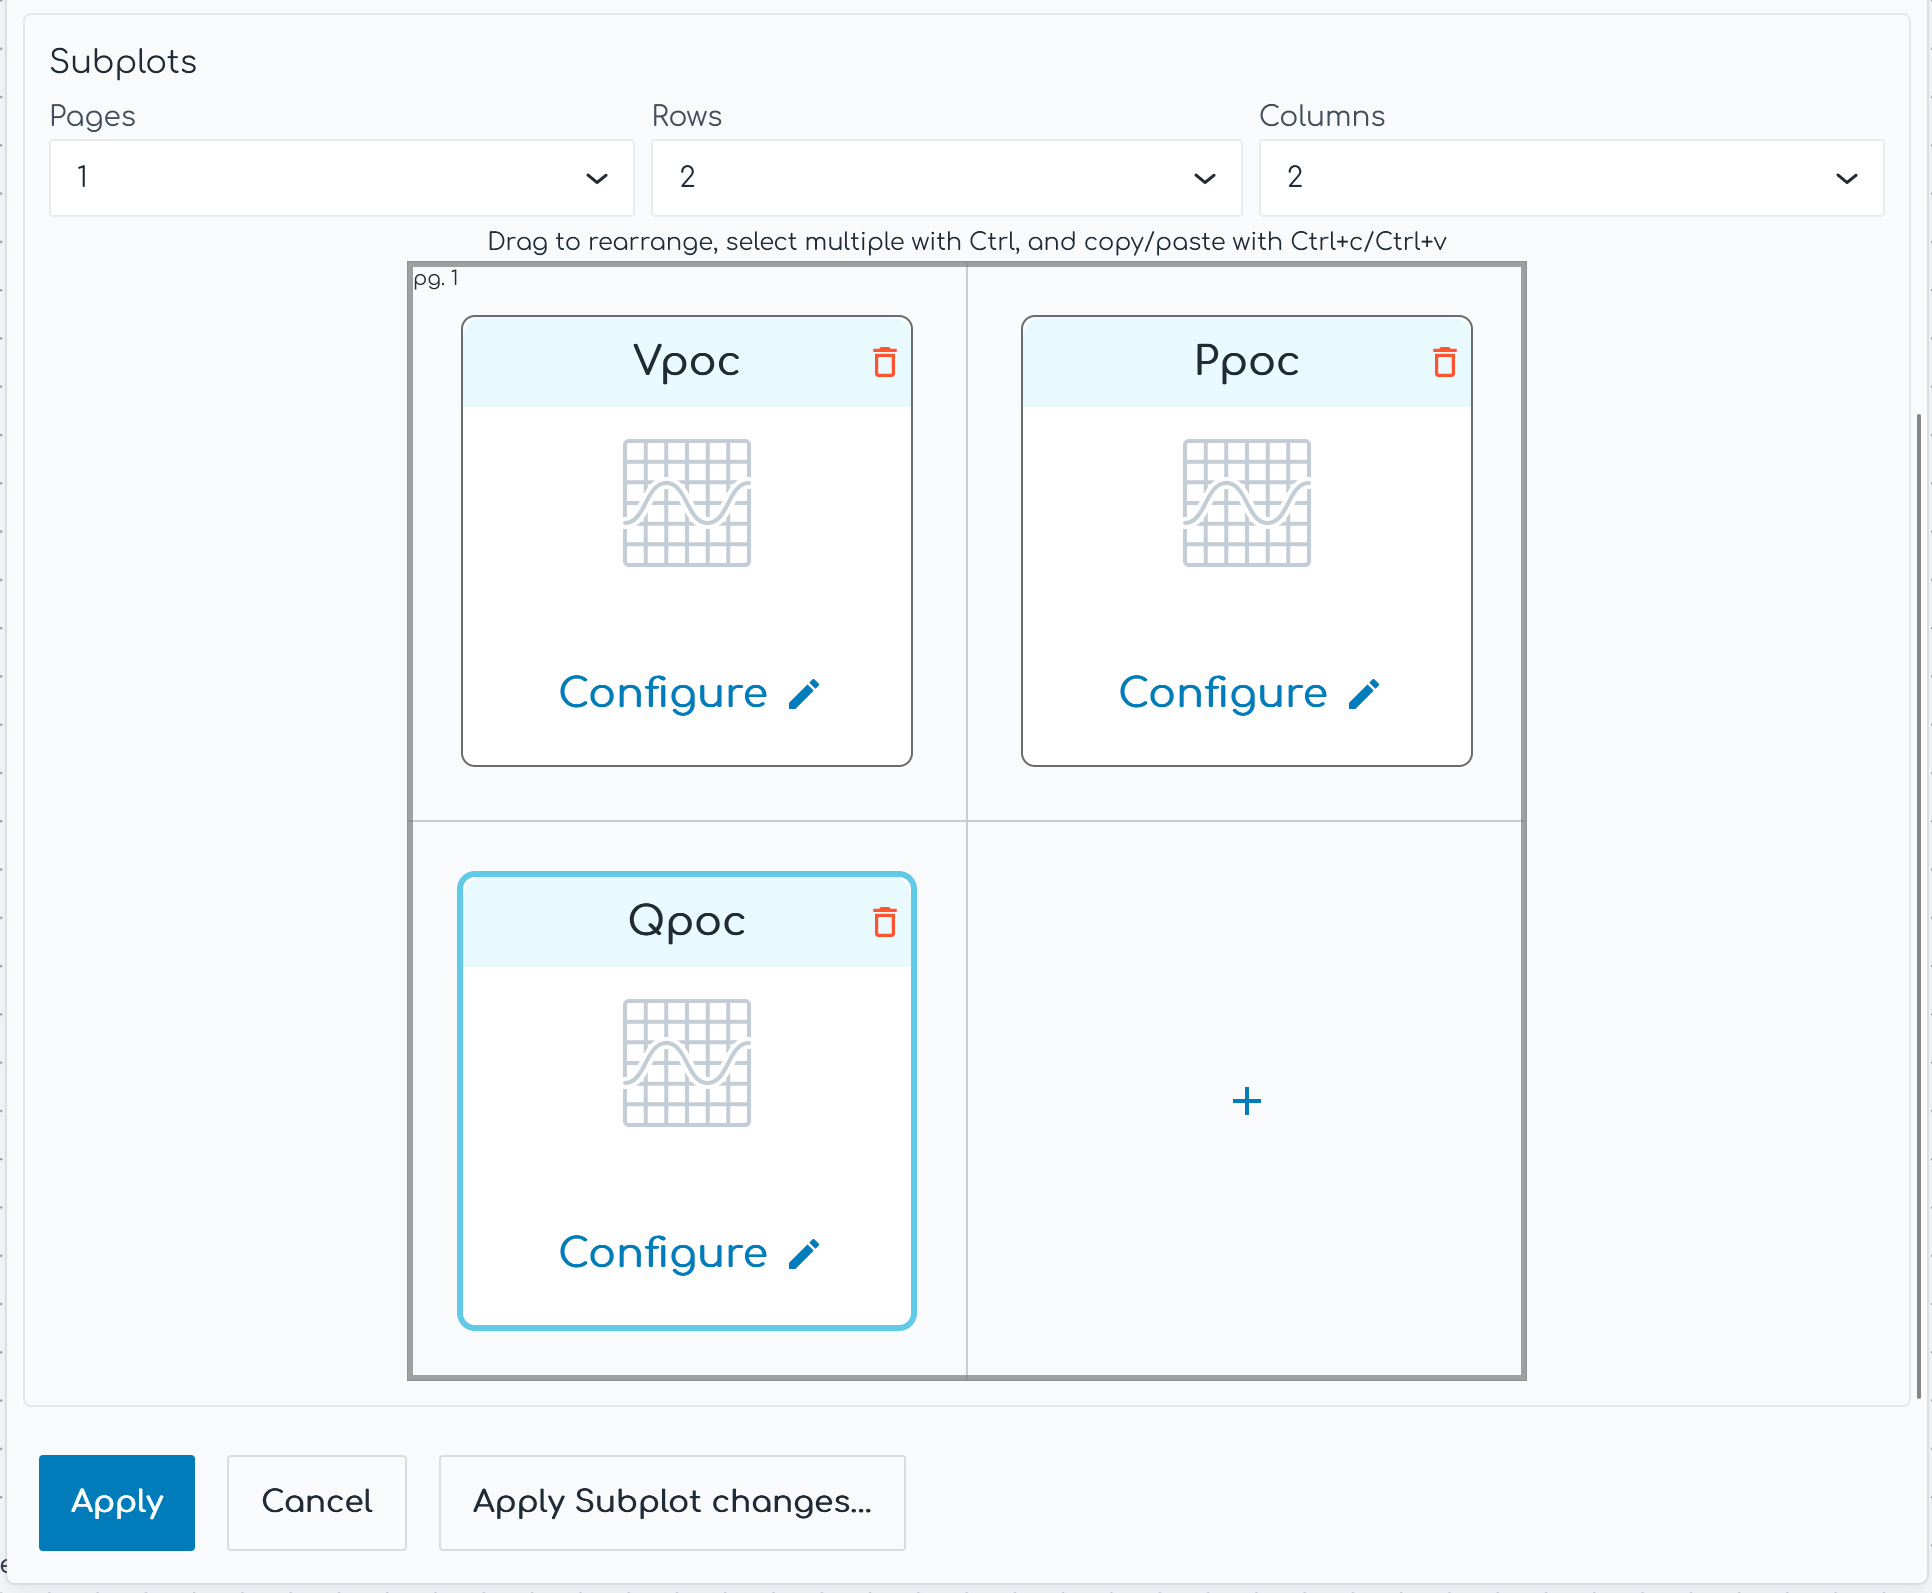
Example SMIB initialisation from PSSE - In the
Define Subplotstab:- Set the x-axis minimum
3and maximum to10 - Under
Subplotsselect1page,2rows and3columns. - Click on the
+to add a new subplot. For each subplot:- Enter a title in
Subplot title, such asVpoc - Under
y-axis Channelsenter each of the Internode Variables with the double curly brackets, such as{{i_ch_poc_v}}
- Enter a title in
- Set the x-axis minimum
7) Launch the Simulation
- Launch the simulation
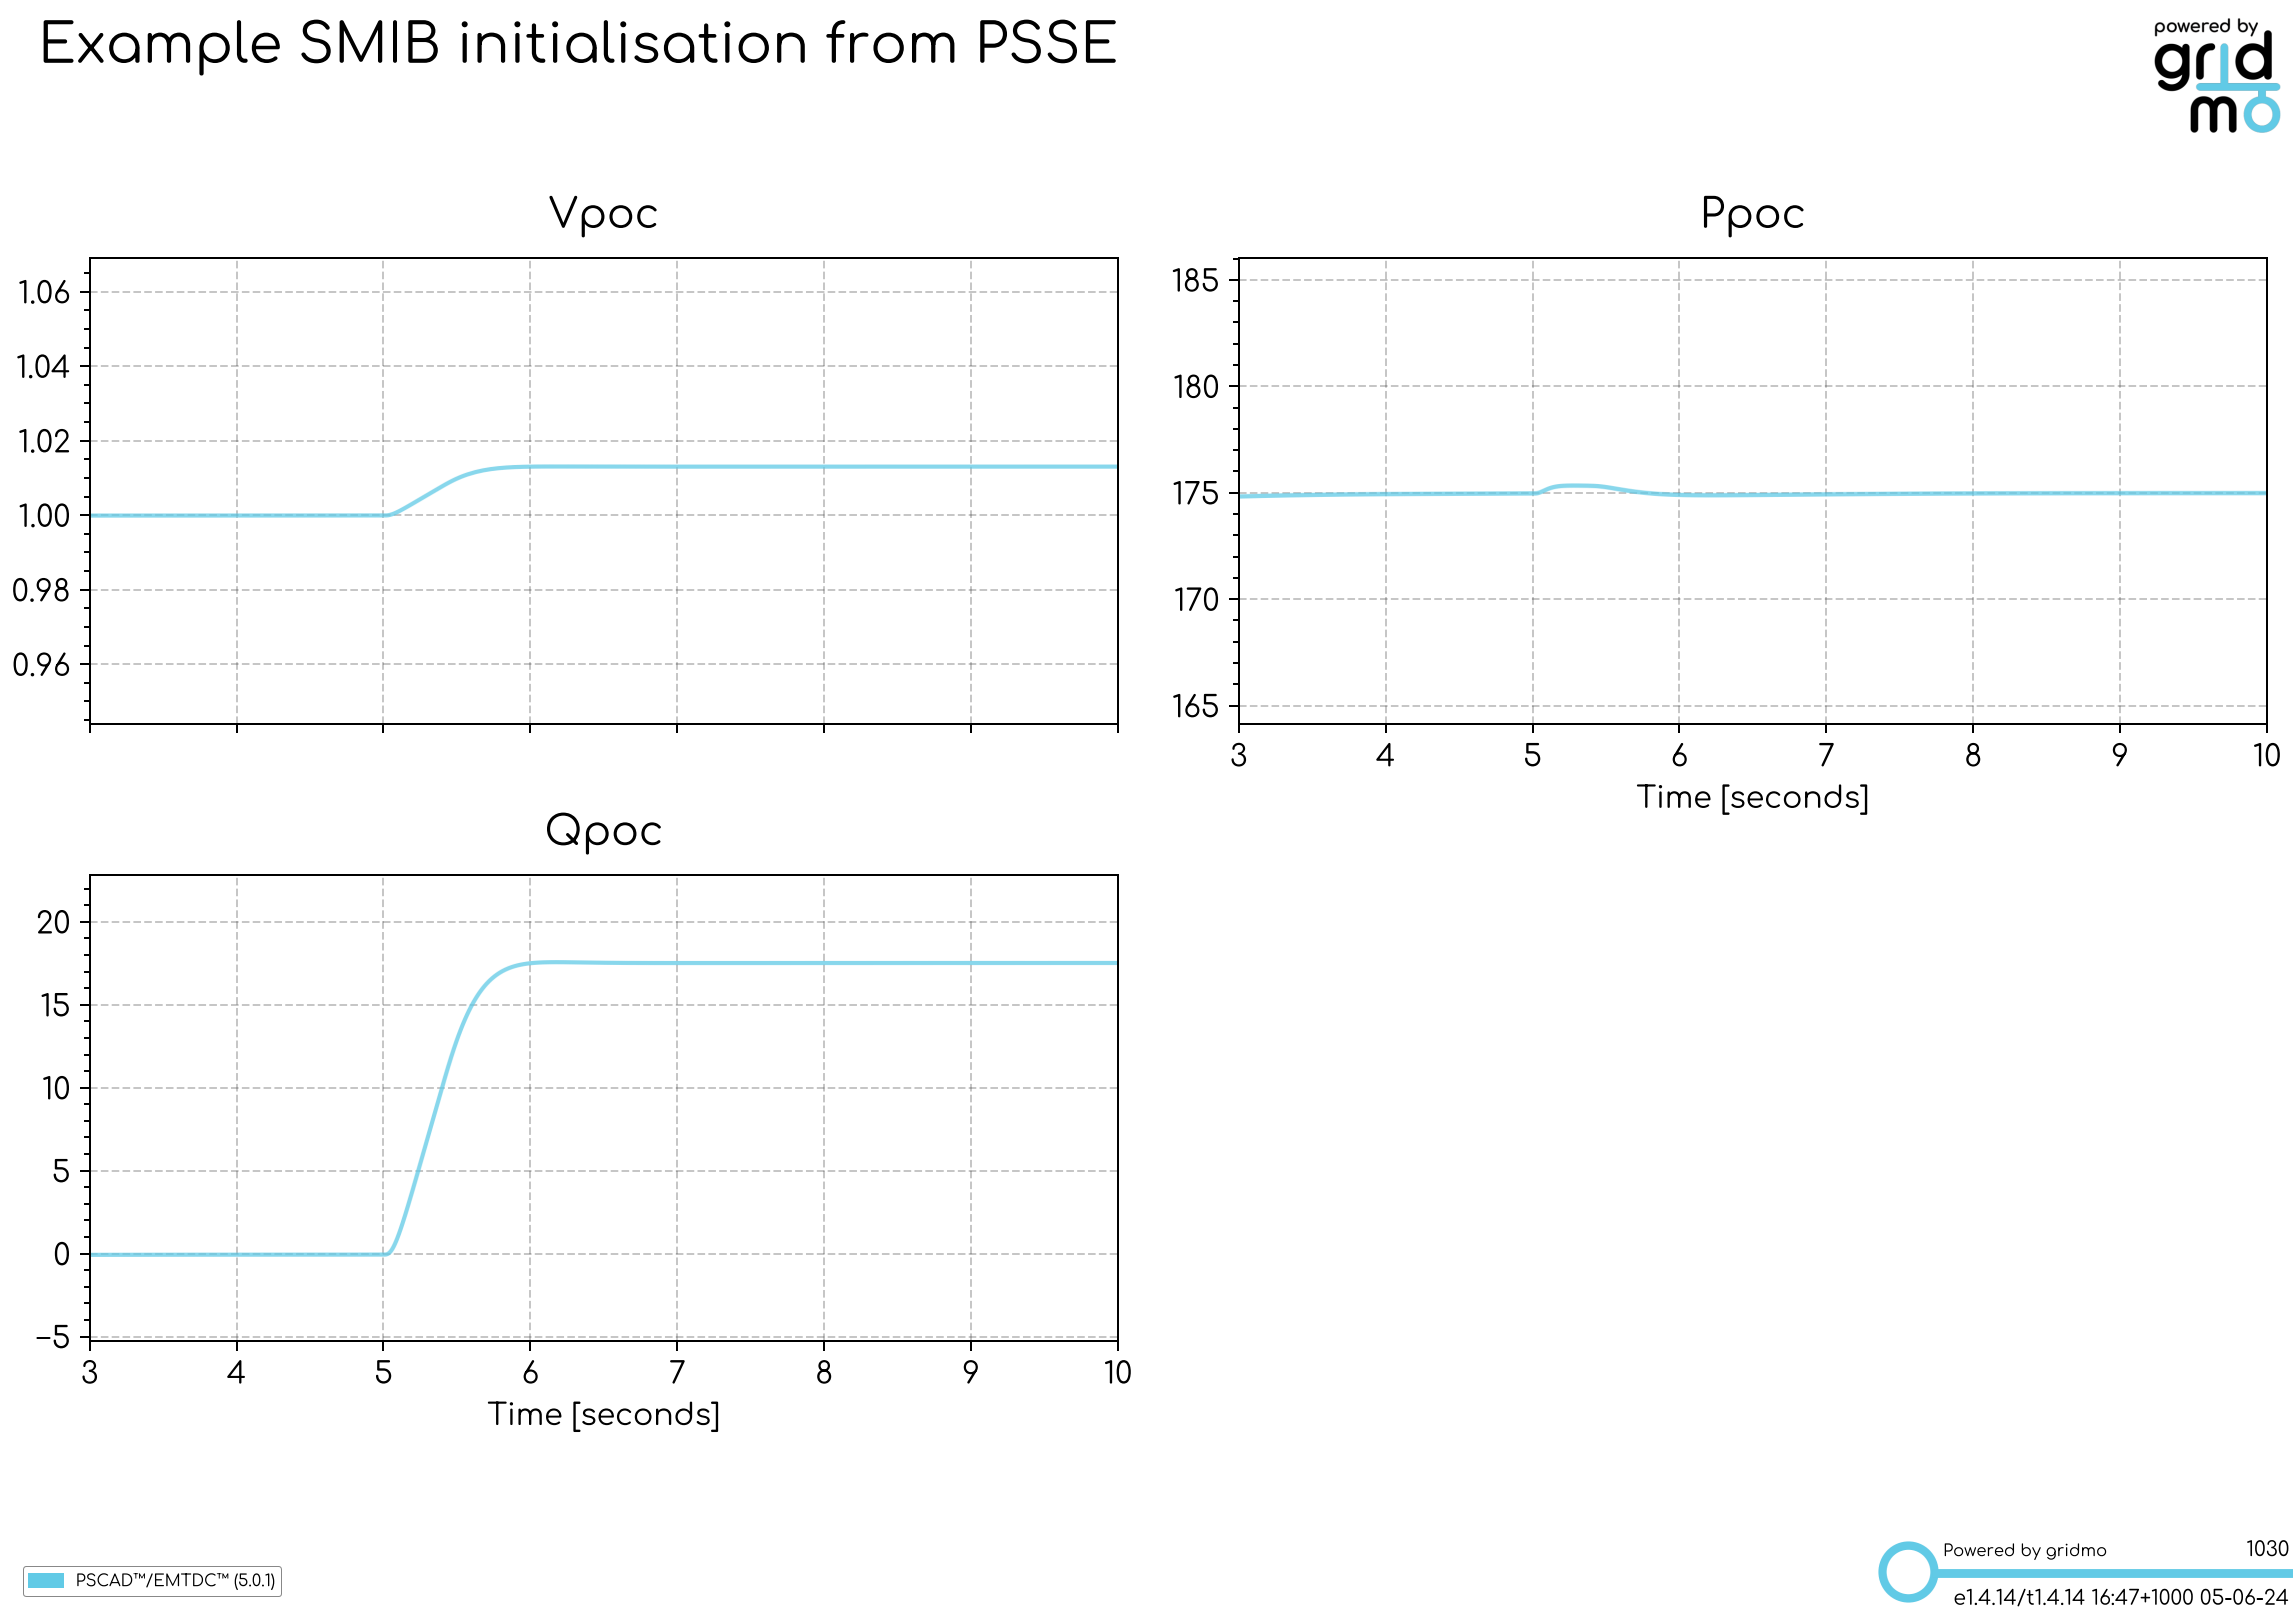
- The output plot should show a PSCAD™ simulation initialized from the static simulation results, specifically:
- It should reach a steady state voltage magnitude of
1.00pu at the connection point. - It should reach a steady state active power of
175MW at the connection point. - It should reach a steady state reactive power of
0MVAr at the connection point.
- It should reach a steady state voltage magnitude of
8) Review the results
An example of the PSSE to PSCAD initialisation.pdf example plot is shown below.
We can see that the PSCAD™ simulation has been initialized to the desired values (1.00 pu, 175 MW and 0 MVAr) from the static simulation.