Improving benchmarking using manual alignment mode
Background
In this third part of the data benchmarking series, we will use the Data Node's alignment capability to improve the benchmark with the PSS®E result.
You can download the complete example project file used in this series from the below link. The example data file and the models required to run this example simulation are packaged with the gridmo Engine - no further configuration is required.
In the previous section, we overlayed a PSS®E dynamic simulation with our real-world data and saw a very poor benchmark. To improve this, we first need to review our source data in Excel (or similar).
Example
1) Open the source data in Excel to find the index of the step
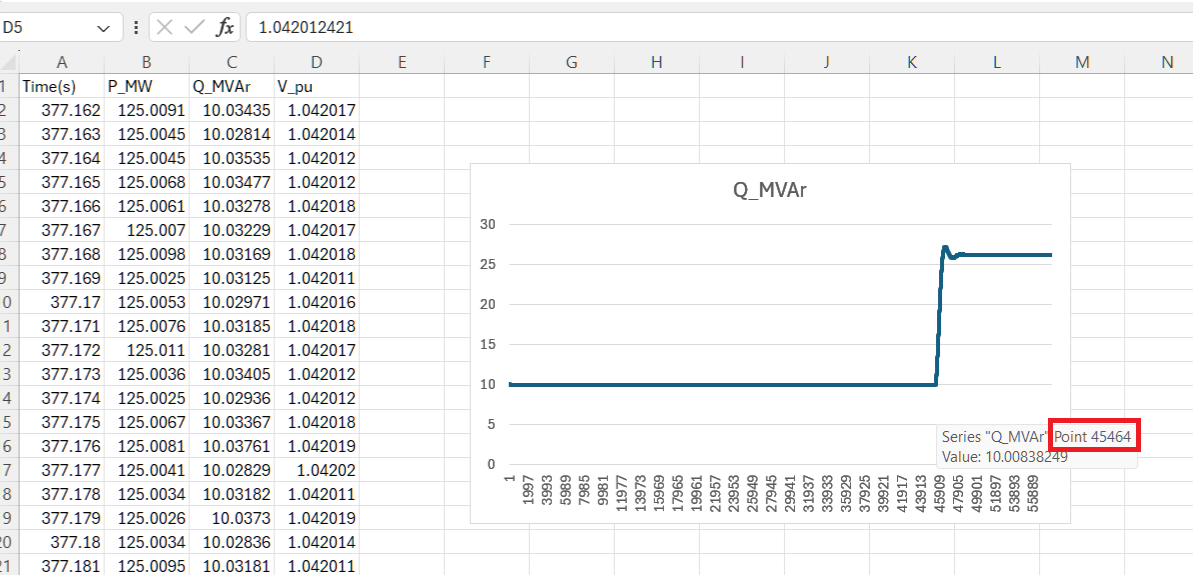
You can find the example data in your gridmo Engine's Inputs folder in the gridmo folder, in a subfolder called data. The file we are using for this example is e002_q_step_data.csv.
We can see:
- The time column starts from approx 377 seconds, which is relatively common for real-world data which use a timestamp or similar (e.g. it doesn't start at
0seconds). - By creating a 2-D line plot using the
Q_MVArcolumn, we can see that the reactive power step occurs at an index (row number in Excel) of approximately45500. - Our aim is to tell the gridmo platform to shift the real-world data so that the reactive power step occurs at a defined time in the 'simulation' world e.g. at same time as the PSS®E simulation.
gridmo uses row indices (numbers) instead of time values for alignment.
This is because:
- The data might be in a complex timestamp format, which is common if exported from an Elspec PQM (for example
17/04/2024 7:15:32 PM) which adds unnecessary calculation burden on you (to convert a timestamp into seconds since start of a simulation). - Even if the data is in a simple format like seconds (similar to our example data), requiring a time offset requires extra calculations on your behalf if the data doesn't start at
0seconds - which is common especially if exported from real-world data.
2) Update the Data Node to use manual alignment mode
- Double click on the
DataNode. - Select the
Process datatab in the Node configuration window. - Select
Manual alignbutton in theX-axis shiftarea.- In the
Row numberfield enter the row we found from excel, in our example45464. - In the
Time [seconds]field enter the time in seconds that the step occurs in the simulation, in our example5seconds.
- In the
- Click
Applyto save the changes
We have now configured the Data Node to shift the real-world data so that the reactive power step occurs at 5 seconds in the simulation world.
3) Update the PSS®E Dynamic and Plot Node to have a shorter simulation time
Now that we've shifted the real-world data and the reactive power step isn't occurring around the 45-second mark, we can update the PSS®E Dynamic and Plot Nodes to have a shorter simulation time so the output plot is easier to read.
- Double click on the
PSS®E DynamicNode. - Under the
Define simulationtab, set theSimulation time [seconds]to10seconds. - Click
Applyto save the changes
- Double click on the
PlotNode. - Under the
Define subplotstab, set thex-axis Min [seconds]to4and thex-axis Max [seconds]to10. - Click
Applyto save the changes
We have now configured the Data Node to shift the real-world data so that the reactive power step occurs at 5 seconds in the simulation world.
4) Launch the simulation
- Launch the simulation using the green
Launchbottom in the top right of the web-app and enter your Engine ID.
5) Review results
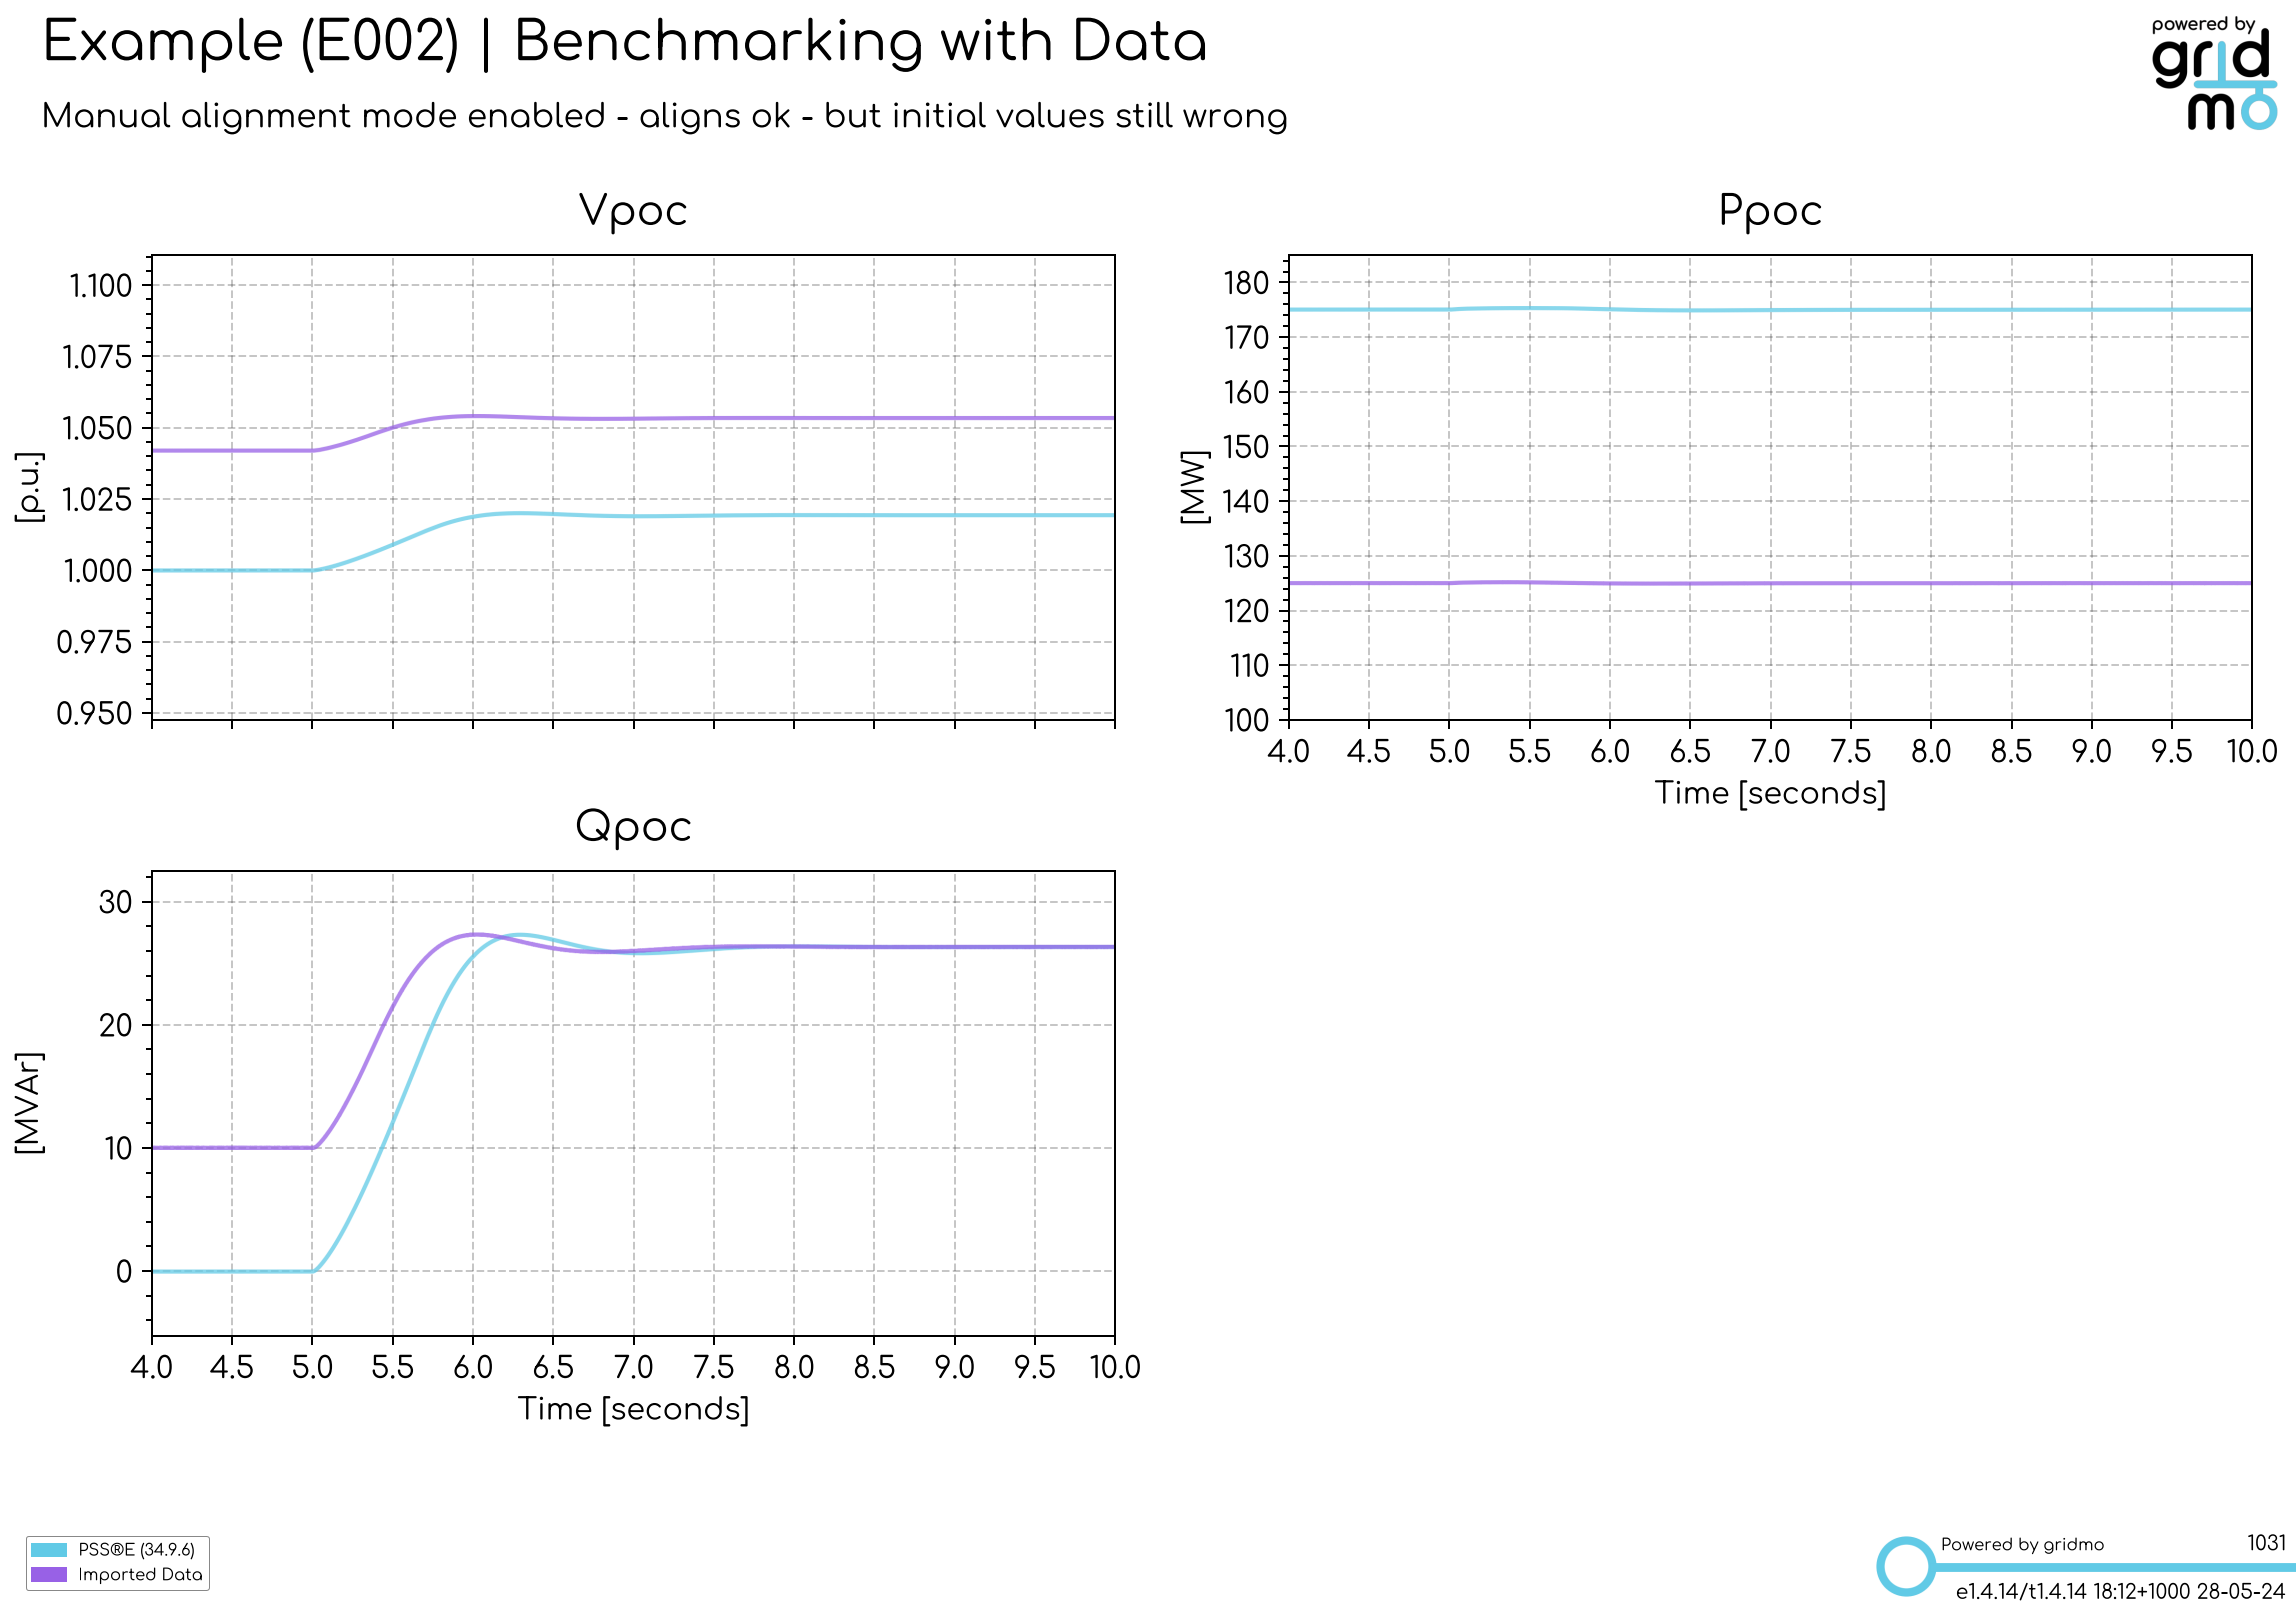
- We can see in our outputs folder (example below) that our real-world data has been shifted:
- ✅ The reactive power step now occurs at
5seconds in the simulation. - ⚠️ The benchmarking is better, but still poor (initial active power, reactive power and voltage are still incorrect) .
- ✅ The reactive power step now occurs at
Next step
In the next step, we will export the initial values from the Data Node and import them into the PSS®E Static Node to improve the benchmarking even further.