Example: How to find the SCR of real-world data

Example version: v1
Software required:

Background
Example file to demonstrate how to use gridmo Loop Variables to find the underlying short circuit ratio (SCR) from real-world data.
The example loads the data using a Data Node, and outputs the average P, Q and V at the connection point for the first 15 seconds. It then uses this data to initialise a PSSE Static model. The example then applies a 3% Vref positive step in the PSSE Dynamic model and plots the overlay of the data and the PSSE Dynamic model. The loop is looping over SCR, so you can step through the tests to see the visual overlay where V and Q align.
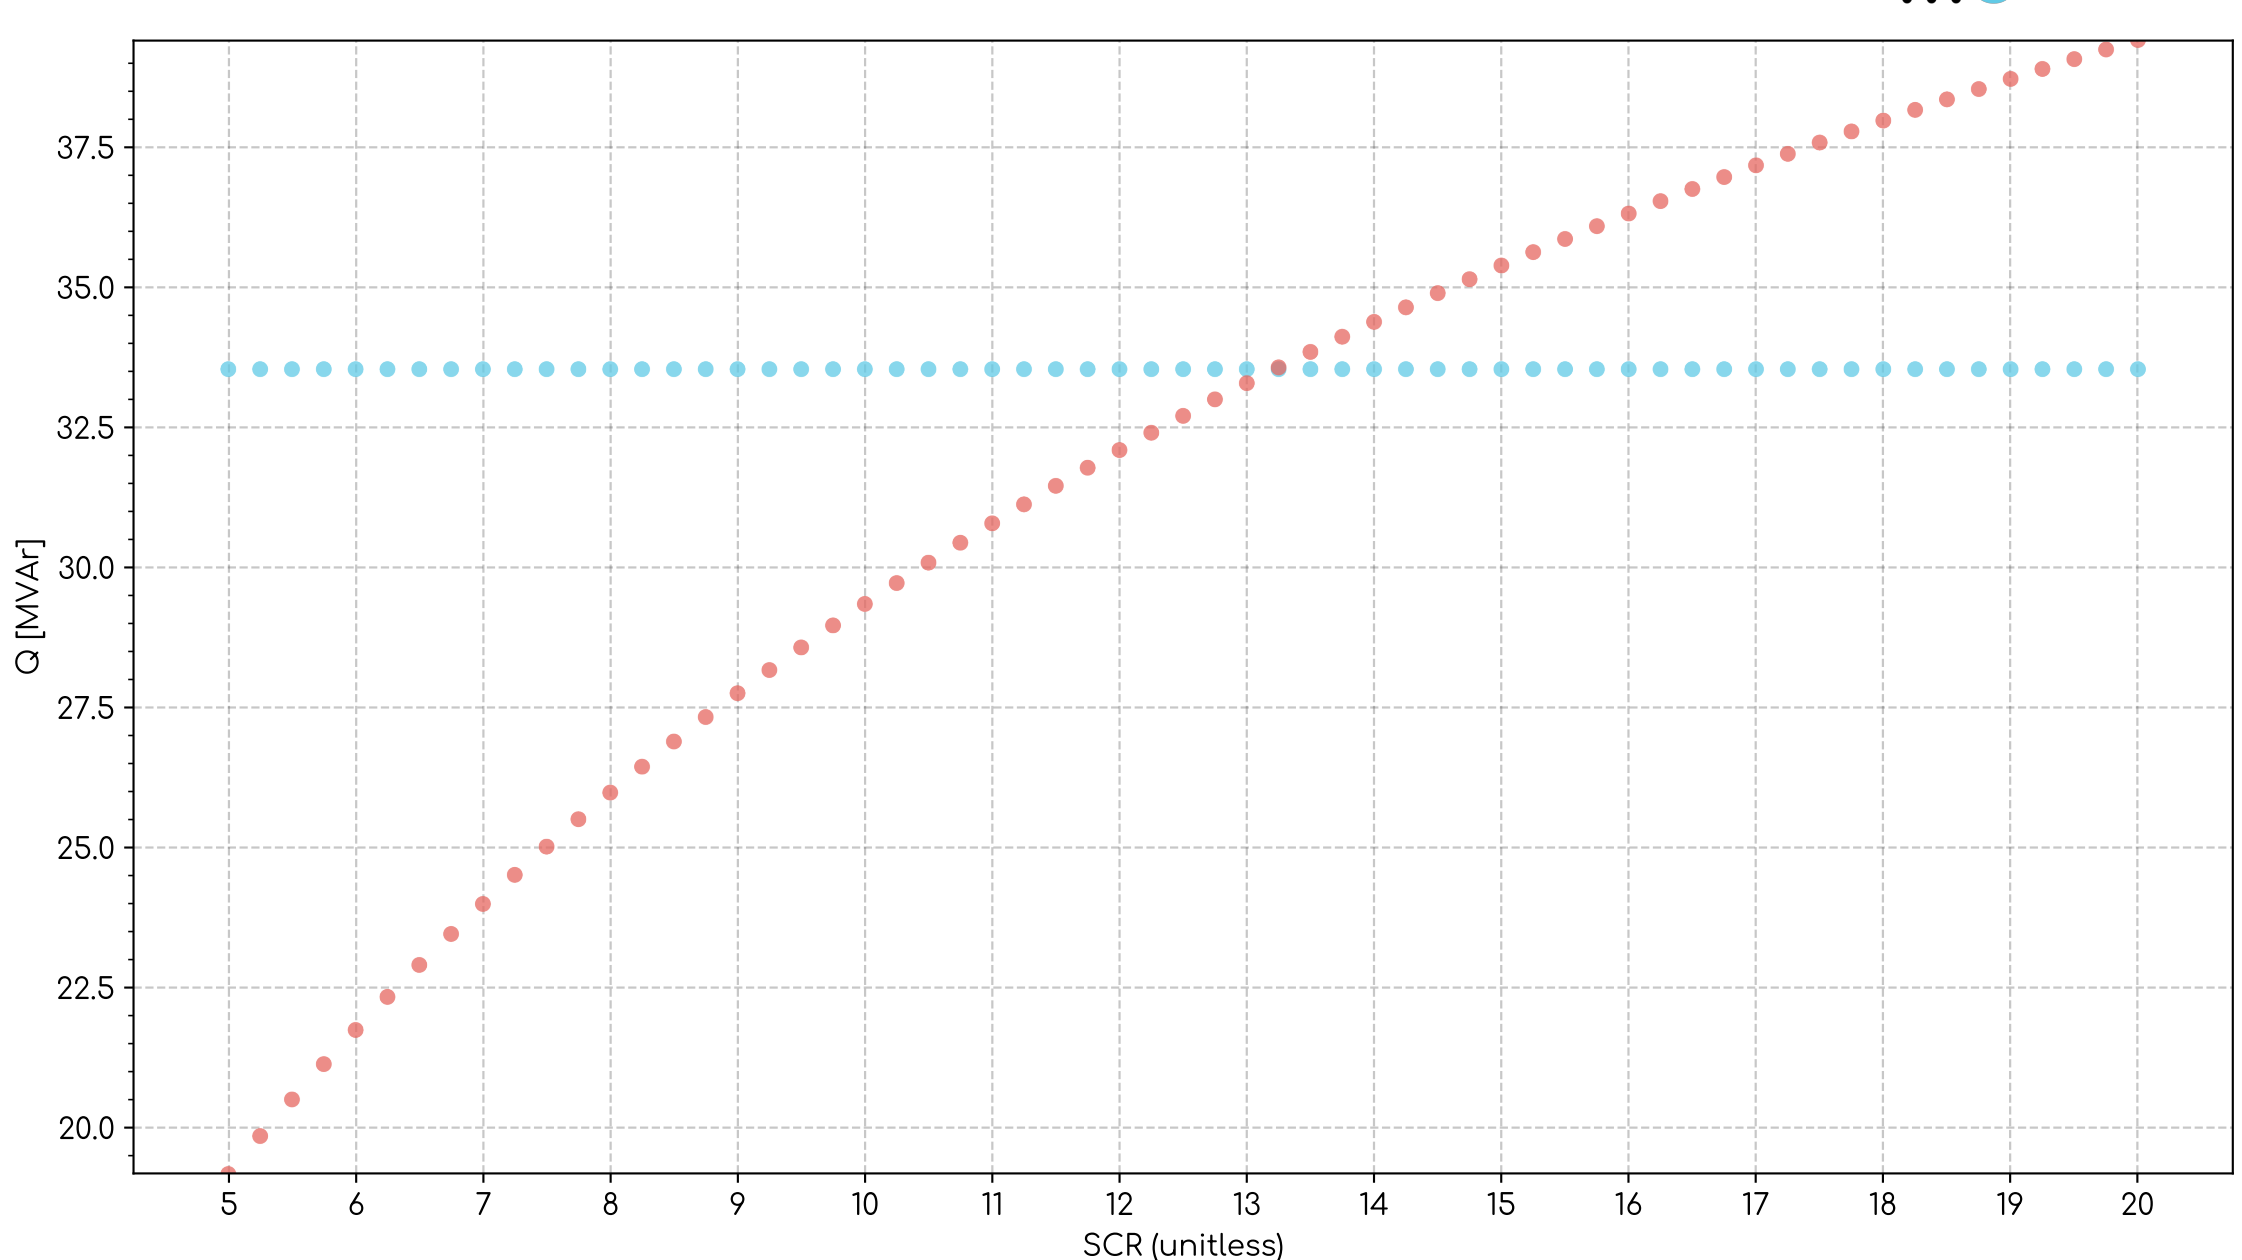
We then use the plot to calculate the average of the last ~10 seconds post step of the data and the PSSE Dynamic result. We export that to a table, then to a pair of scatter plots. Where the two channels on the scatter plot crosses, it gives us the reasonable SCR range. In this case an SCR of 13-16 is reasonable based on the results.
Revision history
- 30 December 2024
- First release of example file.