Example: How to group results by colors in a scatter plot

Example version: v1
Software required:
PSS®E

Background
Example file to demonstrate how gridmo uses the Outputs description field in the Define outputs tab of PSS®E / PSCAD™ / PowerFactory Nodes to group results by color.
Results are grouped into colors by:
- Node ID (all results from the same Node will be assigned the same color - or will be assigned a slightly different color if they are being overlaid on the same sub-plot)
- Description (all results with the same description within a single Node will be assigned the same color)
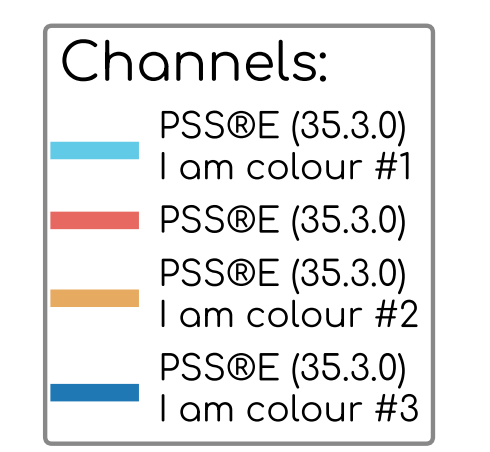
In this example file, note that the PSS®E Dynamic Node 1010 has a Outputs description field that includes a loop variable. This loop variable is used to group results by color in both the time series Plot Node (1011) and the Scatter Plot Node (1013).
Revision history
- 30 December 2024
- First release of example file.