Template: Western Power Generator Performance Standards (GPS)
Template version: v8
Country:

AU
Software required:
Source: Western Power | Wholesale Electricity Market Rules (WEM Rules) | 1 April 2024

How to add this template to your project
- From within your gridmo project, open the flow dropdown and select 'Add flow'.
- Select the template you want to use and click 'Add to project'.
Background
The number and complexity of generation interconnections have increased during the energy transition. In an effort to ensure the adequate performance of generating systems and to ensure efficient design principles by utilising standards where possible, Western Power established Performance Standards in the WEM Rules. Western Power requires proponents to show compliance with these Technical Requirements, as well as other requirements - collectively referred to as "Generator Performance Standards (GPS)". This template includes a selection of tests to demonstrate compliance with these "Generator Performance Standards".
Configuration
To use this template:
- Configure your Global Variables and Scenario Variables using gridmo's Model setup template.
- Download this template using the download button above and load the template into the gridmo Web App.
- Transfer your General tab data, Global Variables and Scenario Variables into this template using the 'Import' buttons in the gridmo Web App.
- Follow the setup steps specific to GPS requirements below.
A12.2 Active Power Capability
The purpose of A12.2 is to demonstrate your generating system's ability to deliver the declared Rated Maximum Active Power continuously across a range of different conditions (e.g. ambient temperatures).
Western Power states that "The result of the steady state load flow should be tested further through an RMS dynamic load flow to test that the control and protection systems do not limit the output active power at the Measurement Location".
In summary, the steady state load flow results should match the dynamic simulation result. It is not acceptable if the steady state load flow results report a greater active power capability than the dynamic simulation result. The steady state load flow results should represent the limitations (controls and protection) that are present in the dynamic model.
Western Power requires the steady-state load flow part of this assessment to be completed using the disaggregated model of the generating system (i.e. full reticulation system). Also known as the 'complete model'.
- A simulation time of 300 seconds is "a period sufficient to capture all control or protection action".
- Auxiliary loads should be set to their maximum power demand.
The ambient temperature is assumed to be 35°C when operating at Rated Maximum Active Power. This applies only to the generic WECC solar model and will need to be updated for your project.
A12.3 Reactive Power Capability
The purpose of A12.3 is to demonstrate your generating system's reactive power capability while operating across a range of different conditions (e.g. active power outputs, connection point voltages and ambient temperatures).
Demonstrating performance is split into two parts:
- Unconstrained reactive power capability: The power plant controller limits are disabled/widened to allow the generating units to reach their maximum reactive power capability without external limitation from the plant controller.
- Constrained reactive power capability: The power plant controller limits are enabled to check operation at the corner points of the proposed reactive power capability curve (Pmax Qmax, Pmax Qmin, Pmin Qmax, Pmin Qmin).
- The constrained assessment is not specifically requested by Western Power, but is an effective and quick way to compare model performance against the GPS requirements (particularly at the corner points).
The unconstrained reactive power capability assessment is completed comparing the performance of three power system simulations for each operating point:
- PowerFactory static (using the disaggregated PowerFactory model)
- PowerFactory dynamic (using the aggregated PowerFactory model)
- PSCAD™
The assessments are completed for the following combinations:
- Connection point voltage: 1.1 pu, 1.0 pu, and 0.9 pu
- Ambient temperature: ISO ambient temperature and maximum ambient temperature of the generating system
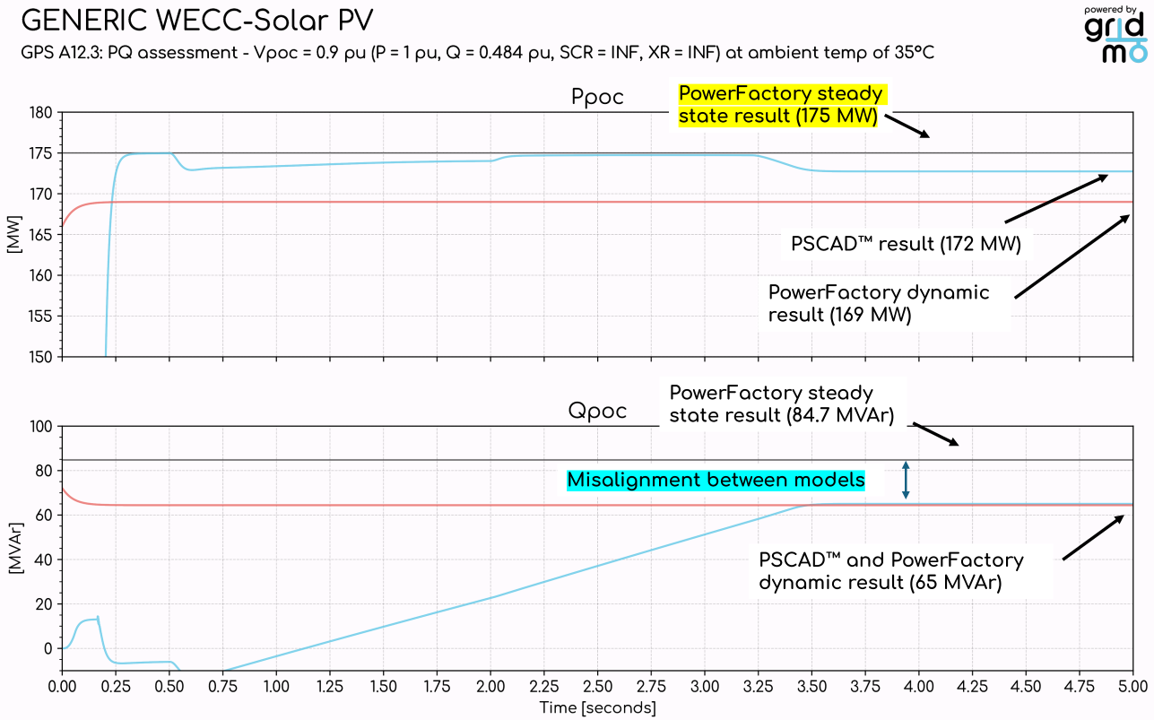
The intention of the static study and dynamic study comparison is to ensure that there is alignment between the models. The disaggregated PowerFactory model is generally used to run static studies to determine the reactive power capability curve for the generating system. It is important that the dynamic model is aligned with the performance of the static model.
The diagram below shows an example where a steady-state load flow simulation (Disaggregated PowerFactory) and dynamic simulation (Aggregated PowerFactory and PSCAD™) results are compared. The dynamic simulation results report a smaller reactive power capability than the steady state load flow result. This indicates that the dynamic simulation results are not aligned with the steady state load flow result. It is also possible to have a dynamic simulation result which reports a greater reactive power capability than the steady state load flow result; this is important to look out for.
- Pcmds: 0 pu to 1.4 pu in 0.1 pu steps to test the full range of active power capability.
- Qcmds: -0.8 pu to 0.8 pu in 0.1 pu steps to test the full range of reactive power capability.
- Tests are conducted at infinite SCR and X/R.
- Transformer tap changers are unlocked.
This template produces a table of results comparing the performance of the three power system simulations for each operating point. The results of this table can be processed by the engineer to match the format requested from Western Power.
A12.4 Voltage and Reactive Power Control
The purpose of A12.4 is to demonstrate your generating system's voltage, reactive power and power factor controller performance.
- A12.4.2.15: "5% step change to the Control System reference" is unclear for Qref and PFref steps. The Qref step size was chosen as 50% of the generating system reactive power capability defined in A12.3 (i.e. 50% × 0.484 × Maximum Rated Active Power). The PFref step was chosen as an equivalent size to the Qref step (i.e. PFref change from 1 to ±0.9719). For steps into limiters, this means that a 2.5% Vref step size is equivalent to 25% of the generating system reactive power capability defined in A12.3 (i.e. 25% × 0.484 × Maximum Rated Active Power).
- Although not specifically requested by Western Power, the Vref, Qref and PFref tests are conducted at both minimum/maximum SCR and X/R.
Step 1 - Q(V) droop curve | Choose grid voltage steps simulation time
Choose the grid voltage steps simulation time for the "Q(V) droop curve" tests so that the duration is sufficient for your generating system to settle. This simulation time will depend on your reactive power control system gains as well as your ramp up and ramp down control limits (e.g. expressed in MVAr/sec). If required, edit the simulation time of the relevant PowerFactory Dynamic, PSCAD™ and Plot Nodes.
Step 2 - Choose Qref and PFref values
Choose Qref and PFref values which correspond to a "...5% step change to the Control System reference" (see above for note). Note that PFref values may be in different units depending on your OEM model (e.g. radians, degrees, unitless). If required, edit the relevant Qref and PFref Commands.
To achieve the same reactive power step size, the PFref step value will need to change depending on the initial active power.
A12.5 Active Power Control
The purpose of A12.5 is to demonstrate your generating system's active power controller performance.
Step 1 - Choose Pref step sizes
Pref step sizes are chosen as ±5% as default. As outlined in [2], "Generating System characteristics may require the step changes to be larger. Larger changes may be considered to more accurately determine equipment performance (e.g. a step size of 10% or 20%)."
A12.6 Inertia and Frequency Control
The purpose of A12.6 is to demonstrate your generating system's frequency control capability.
- Only SMIB studies have been completed. Network-wide studies may be added to further demonstrate that the response is adequately damped.
- Frequency 'steps' are completed at a 4 Hz/s ramp rate.
- A12.6.1.11(b): The maximum response delay is assumed to be 250ms.
A12.7 Disturbance Ride Through for a Frequency Disturbance
The purpose of A12.7 is to demonstrate your generating system's ability to maintain Continuous Uninterrupted Operation (CUO) for a particular frequency operating standard. We've also included tests to ensure that some form of frequency protection exists.
- Tests are conducted at infinite SCR and X/R.
- Tests are conducted using a playback generator with infinite inertia.
- All frequency 'steps' are completed at a 4 Hz/s ramp rate.
- Ride-through RoCoF: The test methodology involves ramping from 50 Hz to the test frequency at 1 Hz/s over the simulation time of 5 seconds to 6 seconds. The RoCoF is then applied at the simulation time of 10 seconds.
Step 1 - Choose frequency operating standard
Choose a frequency operating standard in accordance with Appendix 13 of [1]. The frequency operating standard from Table 1 of Appendix 13 of [1] has been chosen by default. If an alternate operating frequency standard is chosen, update the relevant SMIB playback tests in the Nodes.
A12.8 Disturbance Ride Through for a Voltage Disturbance
The purpose of A12.8 is to demonstrate your generating system's ability to maintain Continuous Uninterrupted Operation (CUO) for particular voltages at the connection point. We've also included tests to ensure that some form of voltage protection exists.
- Ride-through tests for each voltage range are chosen such that the time spent within that range includes any time spent in the more onerous ranges.
- A12.8.2.1(a): Voltage exceeding "130% of nominal voltage" is represented by 132%.
A12.9 Disturbance Ride Through for Multiple Disturbances
The purpose of A12.9 is to demonstrate your generating system's voltage disturbance ride-through performance. There are several criteria when assessing this performance:
- FRT transition bands | SMIB: Smoothly enter and exit a fault ride-through mode (known as
transition band testsin this template). - Balanced voltage disturbances | SMIB: Response to balanced voltage disturbances must meet
Kpocgain value,Iqrise time,Iqsettling time,Ppocrecovery time and CUO requirements. - Unbalanced under-voltage disturbances: Response to unbalanced under-voltage disturbances must meet
Kpoc_neggain value,Iqrise time,Iqsettling time,Ppocrecovery time and CUO requirements. - Series of disturbances | SMIB: Response to a series of balanced and unbalanced faults. Note: gridmo currently doesn't support
3PHGfaults; these are modelled as3PHinstead. For more information, see theSIMPLEFAULTcommand documentation.
Western Power accepts A12.9 fault simulations demonstrated in either PowerFactory RMS or PSCAD™. Where the RMS model is limiting, they may require an EMT study instead. This template includes both PowerFactory RMS and PSCAD™ studies.
Reactive current quantities (referred to as Iq in this template) are presented in per unit on the Maximum Continuous Current base value. In gridmo, this is calculated on the Sbase (project rated apparent power) which can be defined in the Global Variables.
The assessment window ends when the voltage at the Connection Point returns to the normal range (0.9 p.u. to 1.1 p.u.) and remains there.
Reactive current rise time, reactive current settling time, damping coefficient, and damping ratio are all derived from the total (positive-sequence + negative-sequence + zero-sequence) reactive current channel at the Connection Point.
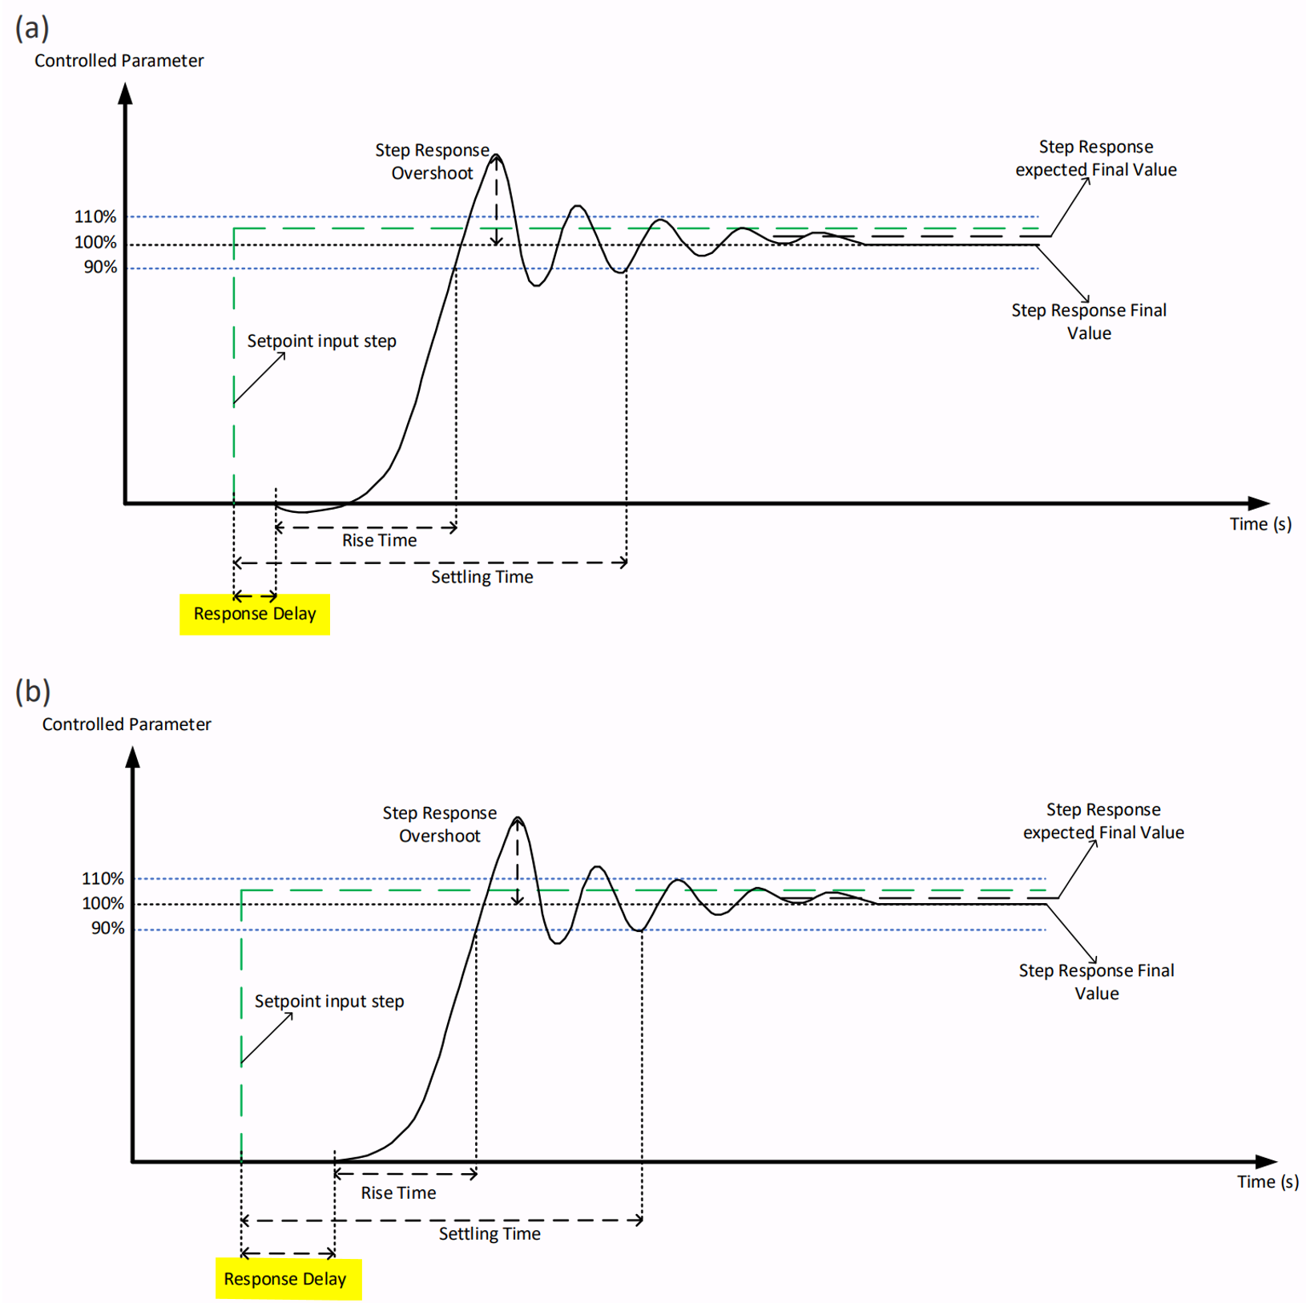
Western Power states that the rise time calculation should not commence until the Response Delay has passed. The criterion for the Response Delay passing is "the time from which the output value moves." However, there is no definition of what "moves" means in practice.
For this assessment, we have assumed a response delay of 0 ms as the simulation results from one time step to another will not be identical once the fault has been applied; there will always be a small change, so the Iq response of the generating system will have "moved".
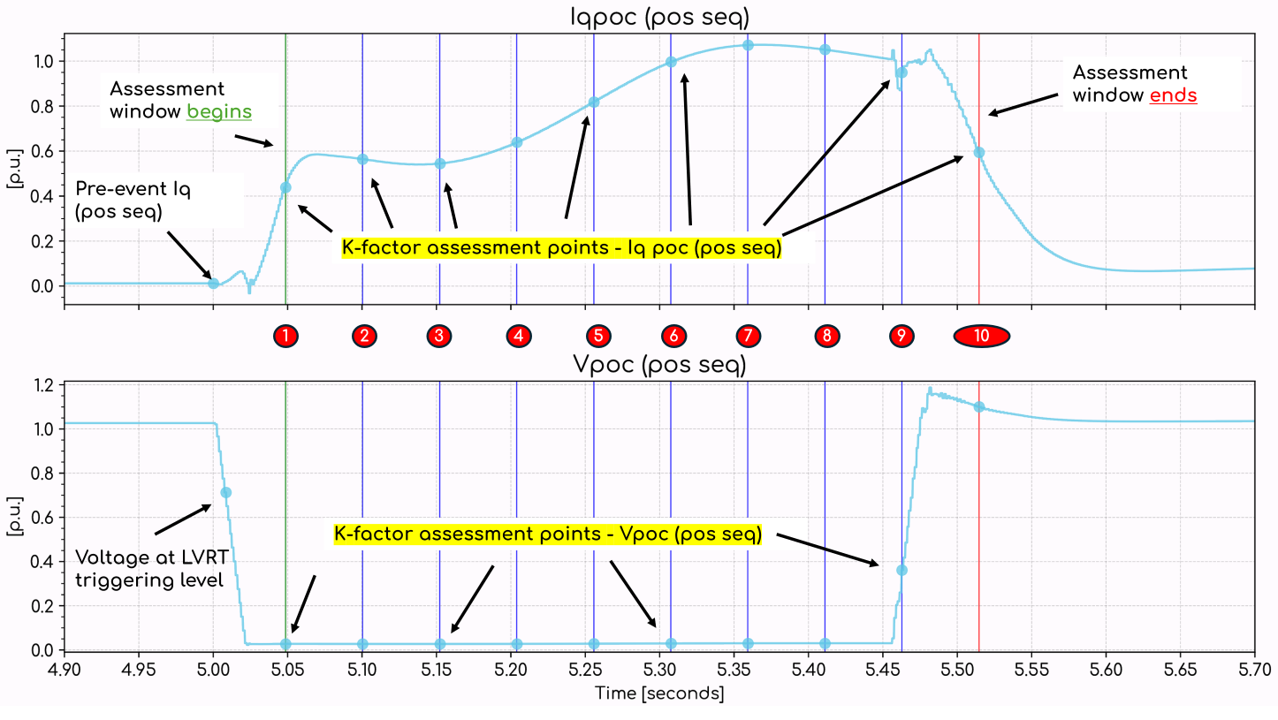
Western Power states that the Kpoc value should be calculated within the assessment window and it is required to be at or above the WEM Rules limit for reactive current injection within the whole duration of the assessment window.
gridmo doesn't presently support calculating the K-factor at each individual time step. Instead, we have calculated the K-factor at 10 points evenly spaced throughout the assessment window as shown in the diagram below. This outputs 10 K-factor calculation values to a table for the engineer to review.
- Asynchronous generating systems
- Synchronous generating systems
The assessment window begins 40 ms after the voltage control mode is switched to fault ride-through mode. This is detected by monitoring the LVRT/HVRT flag. The image below shows an example of this logic from the gridmo outputs. The assessment window ends when the voltage at the Connection Point is recovered back to normal range (0.9 p.u. to 1.1 p.u.) after clearance of the disturbance.
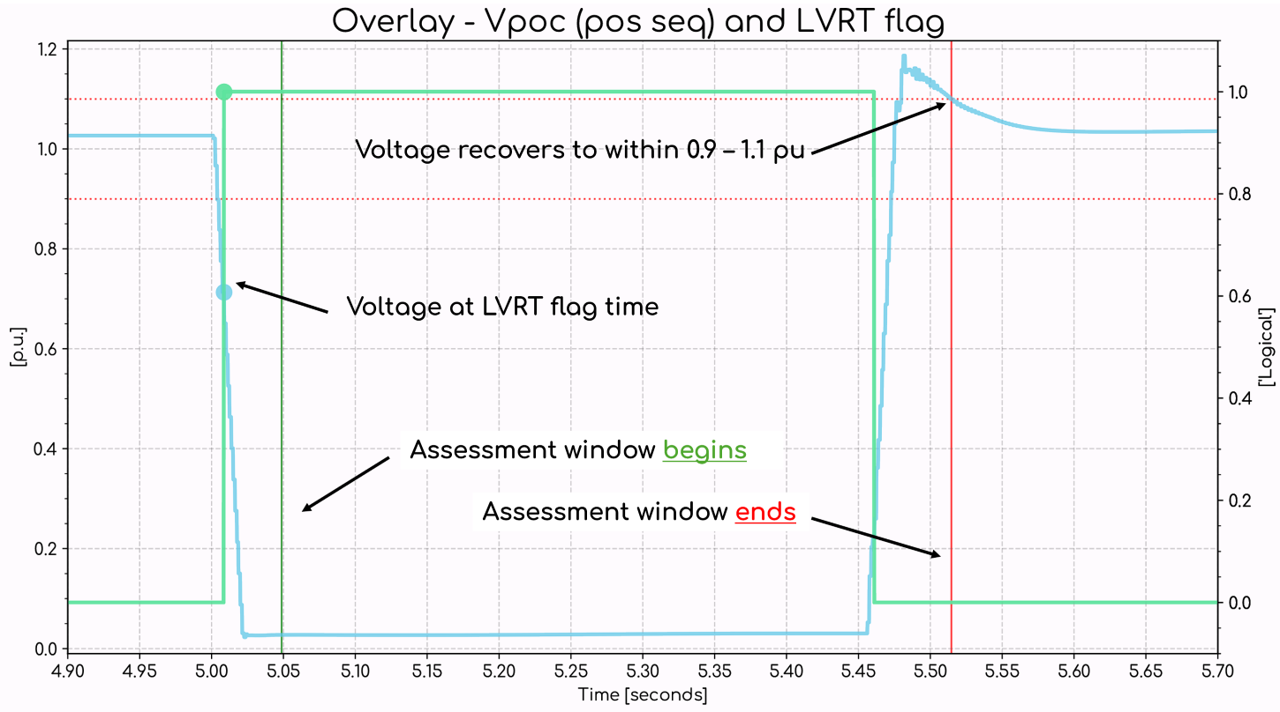
It is unclear how the start of the assessment window is determined for Type III wind generators (DFIG) which do not have LVRT/HVRT flags.
- It is assumed that the assessment window ending is the time at which the voltage at the Connection Point recovers to within the normal range and does not leave it.
Channel definitions:
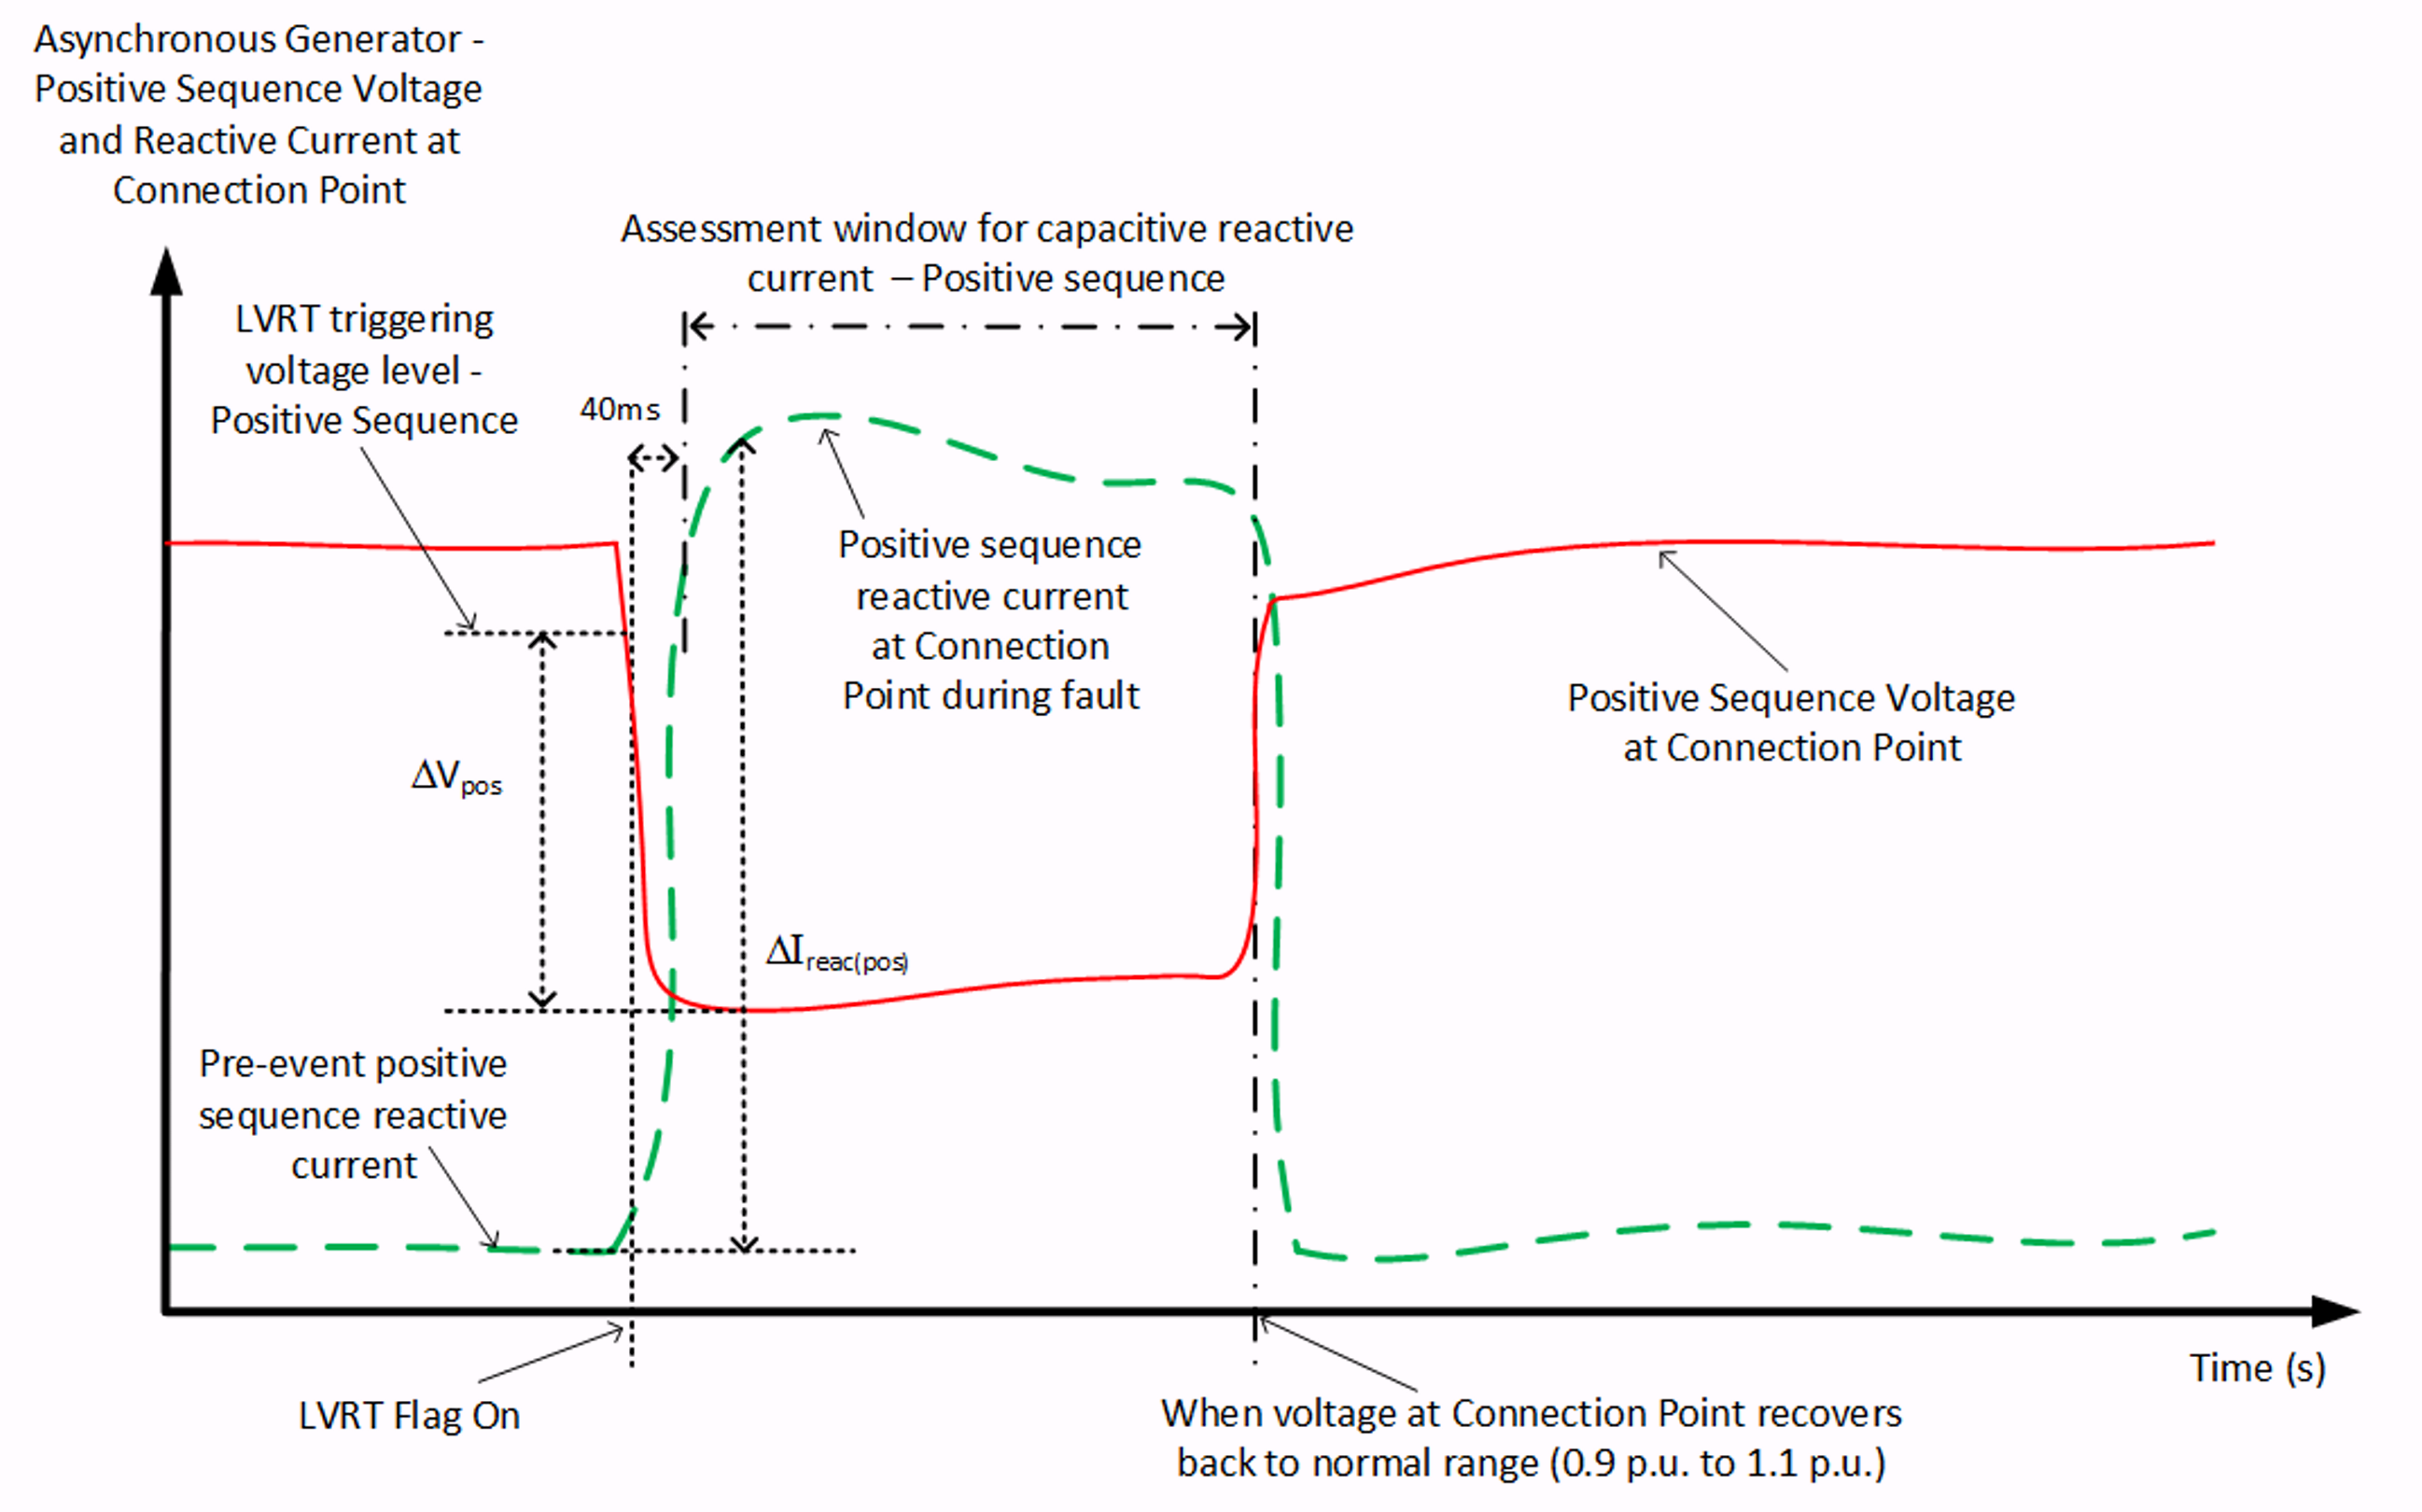
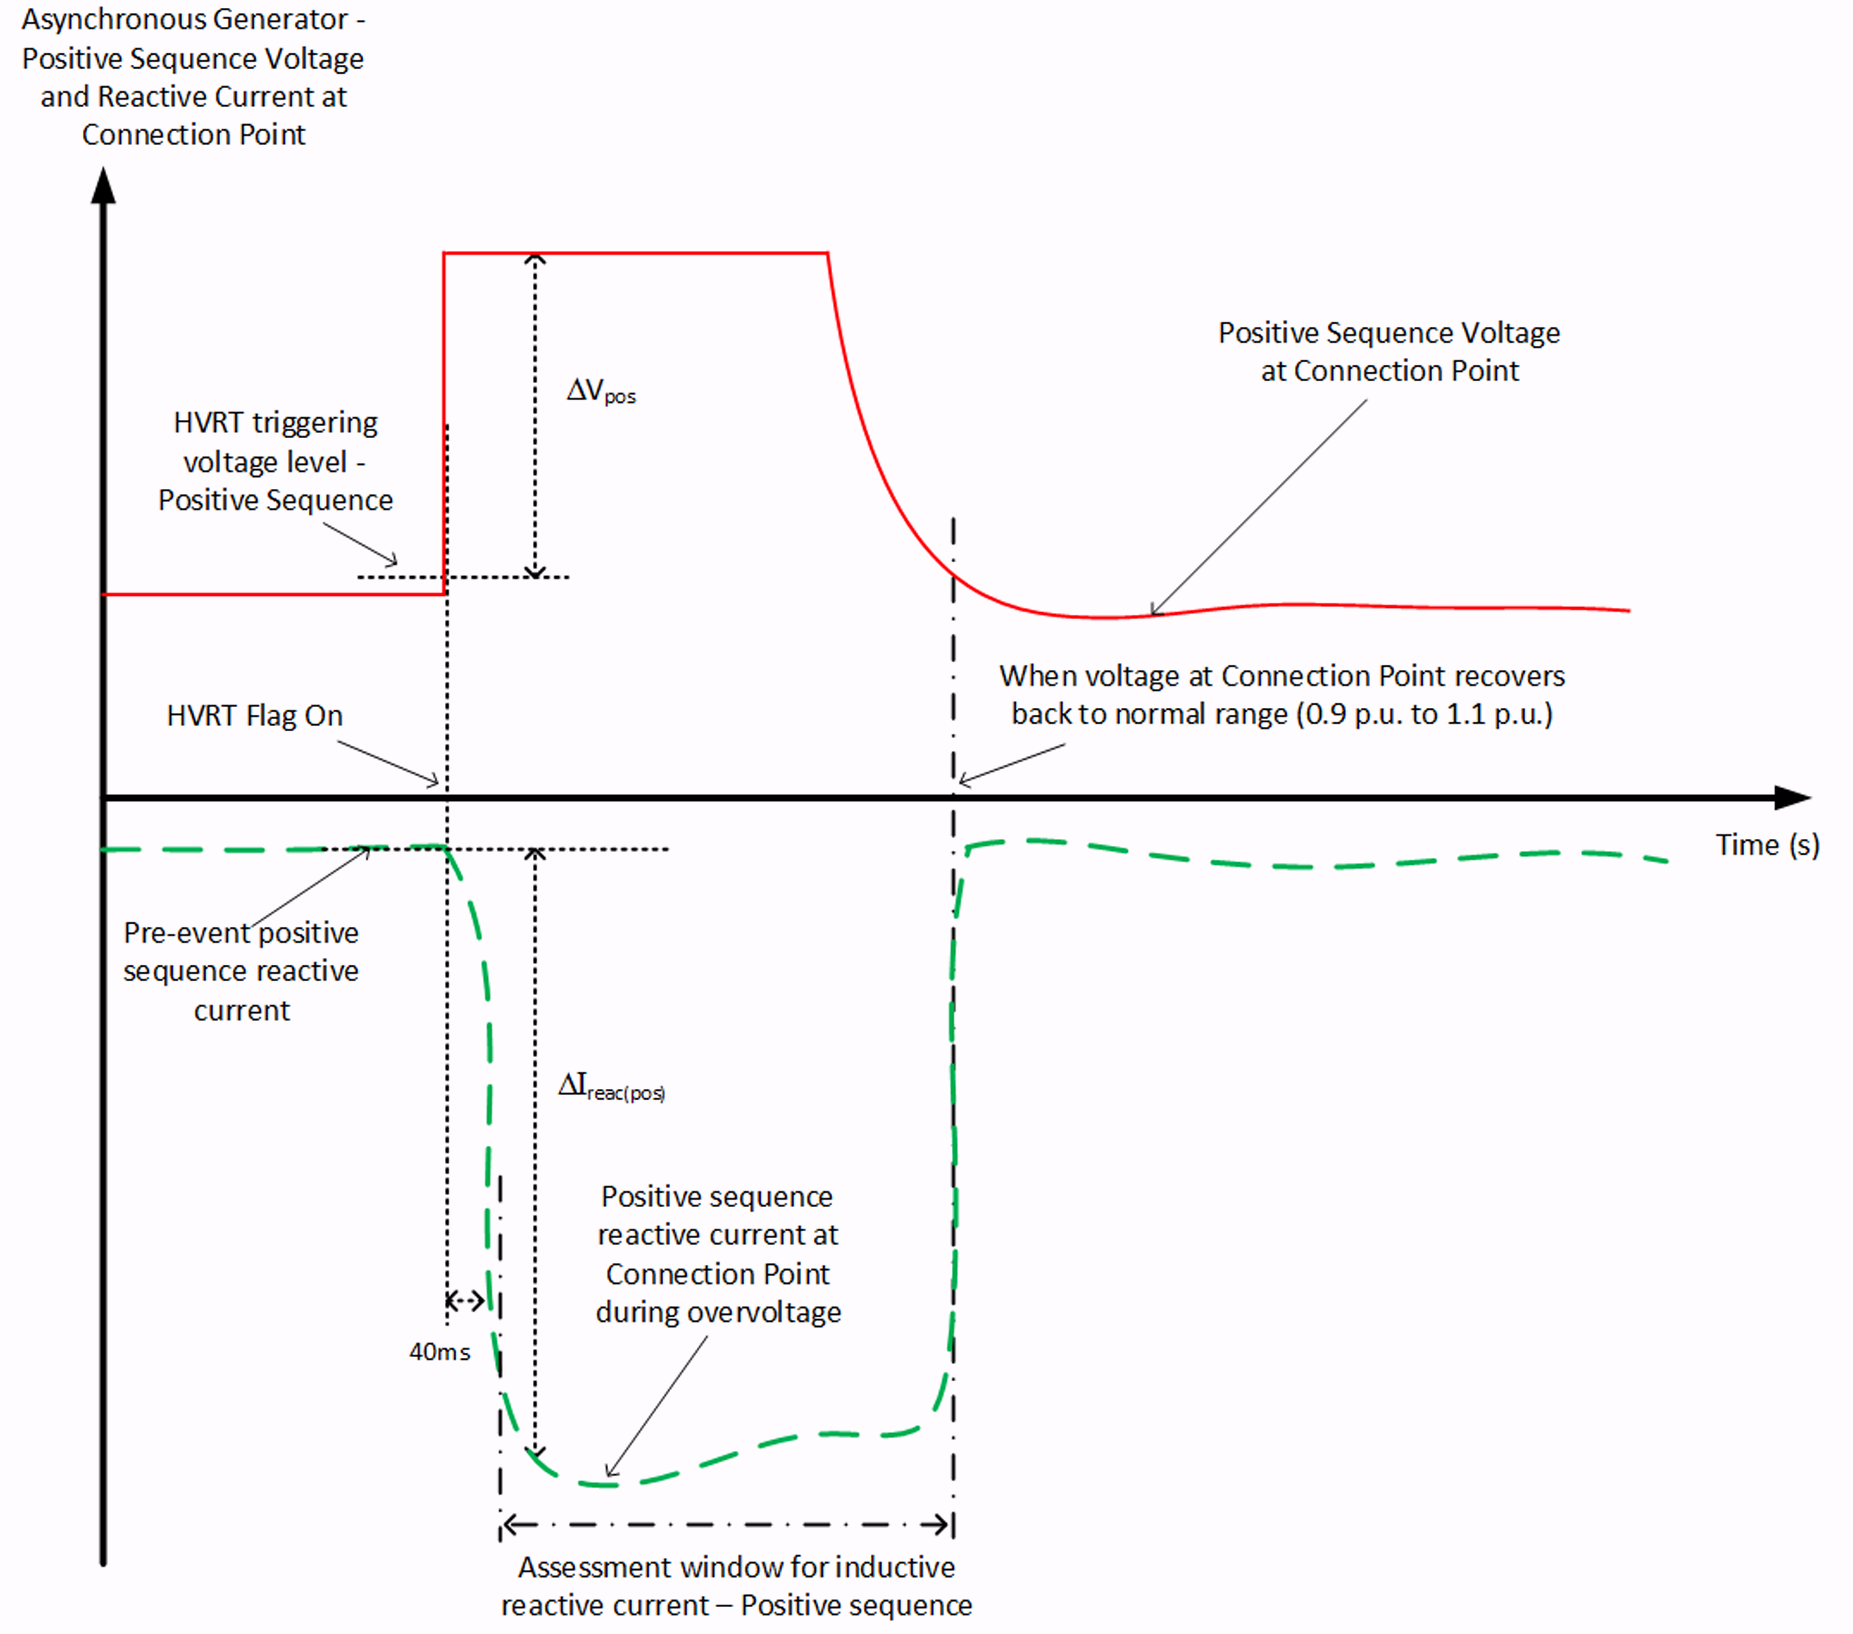
- ΔIreac(poc) is the reactive current during the disturbance minus the pre-disturbance reactive current.
- ΔVpos is the positive sequence voltage at the Connection Point during the disturbance minus the positive sequence voltage at the time step at which the LVRT/HVRT flag is triggered.
- Asynchronous plots (WECC Solar): Western Power ask for PPC freeze/unfreeze flags and total current saturation level in plots. Those quantities are not available in WECC Solar, so the relevant Plot Nodes include empty placeholder subplots.
- PowerFactory (positive-sequence reactive current): Studies use a balanced RMS simulation, which is positive-sequence only.
- Damping of oscillatory reactive current: Per the Power System Stability Requirements Guideline ([5]), oscillations should have damping ratio ≥ 0.1 and halving time ≤ 5 s (damping coefficient ≤ −0.14 Np/s). In this template, damping is assessed on Iqpoc from fault inception to clearance. If the response is not oscillatory, these damping metrics may not apply.
Positive-sequence Iq assessment window (LVRT)
Positive-sequence Iq assessment window (HVRT)
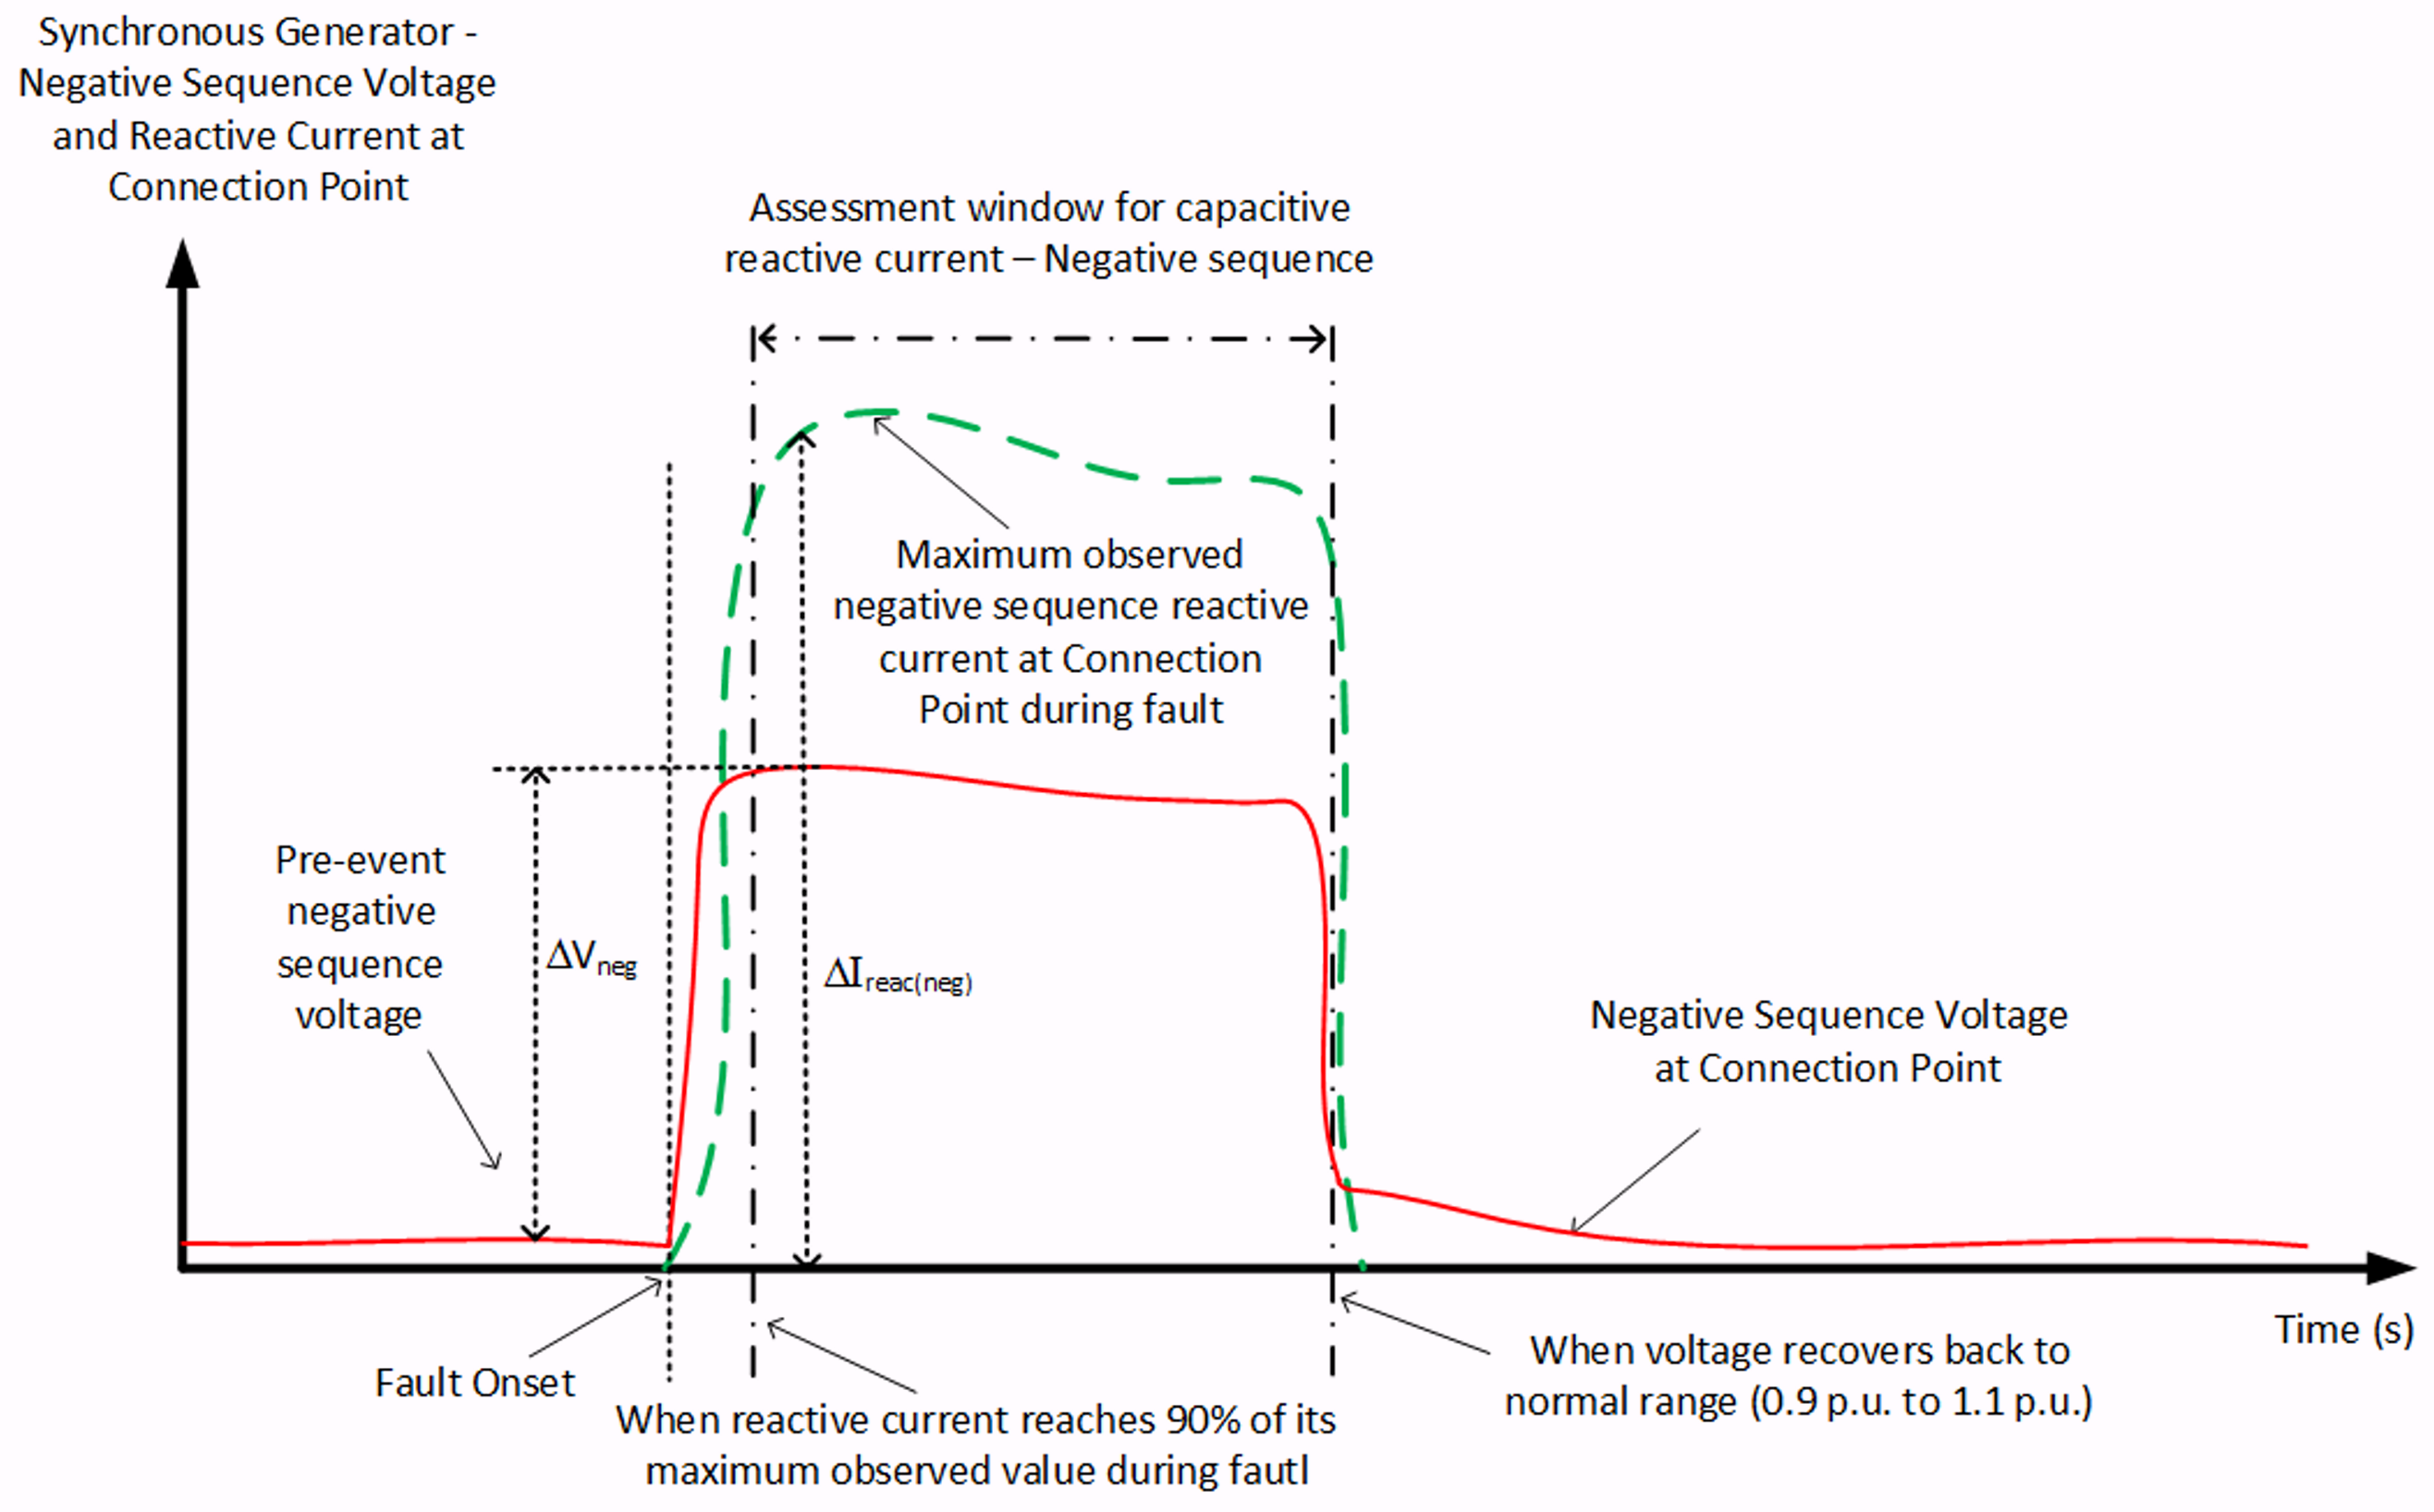
For undervoltage events, Western Power also expects negative-sequence reactive current injection. Agree the required Kpoc_neg gain and the ratio of negative-sequence to positive-sequence reactive current with Western Power and AEMO. Where feasible, target Kpoc_neg ≥ 2.
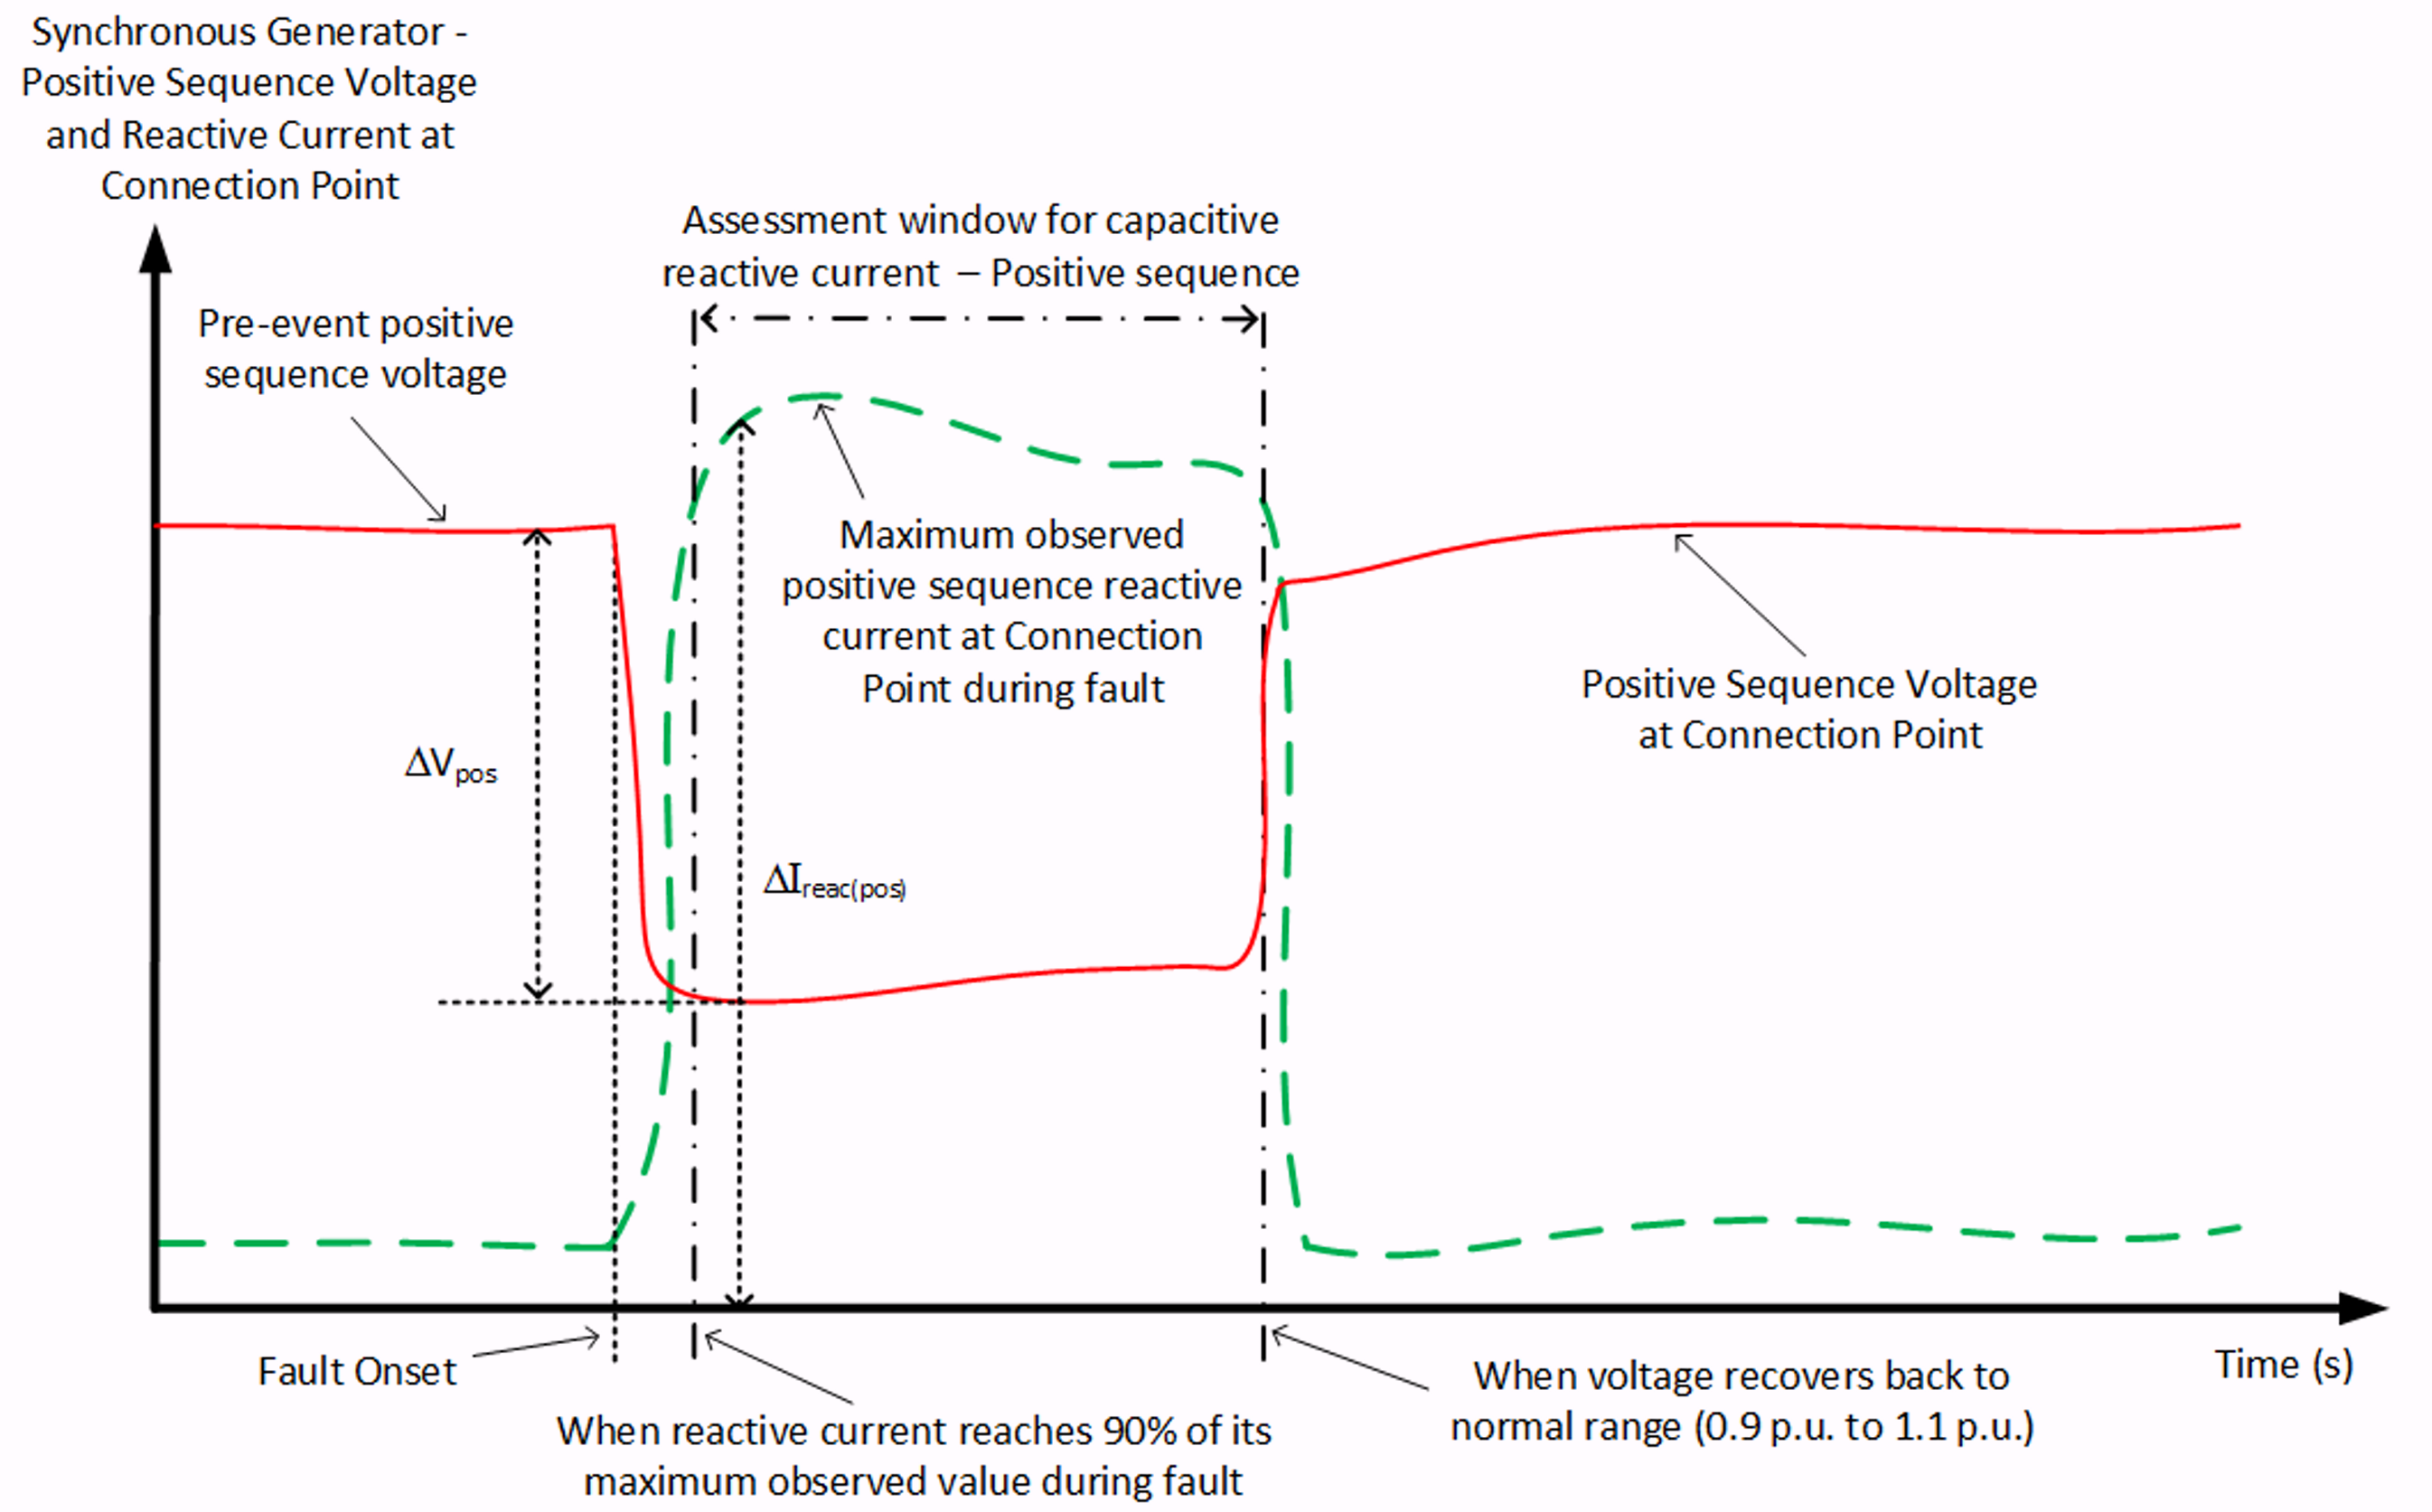
The assessment window ends when the positive sequence voltage at the Connection Point recovers back to normal range (0.9 p.u. to 1.1 p.u.) after clearance of the disturbance.
Negative-sequence Iq assessment window (LVRT)
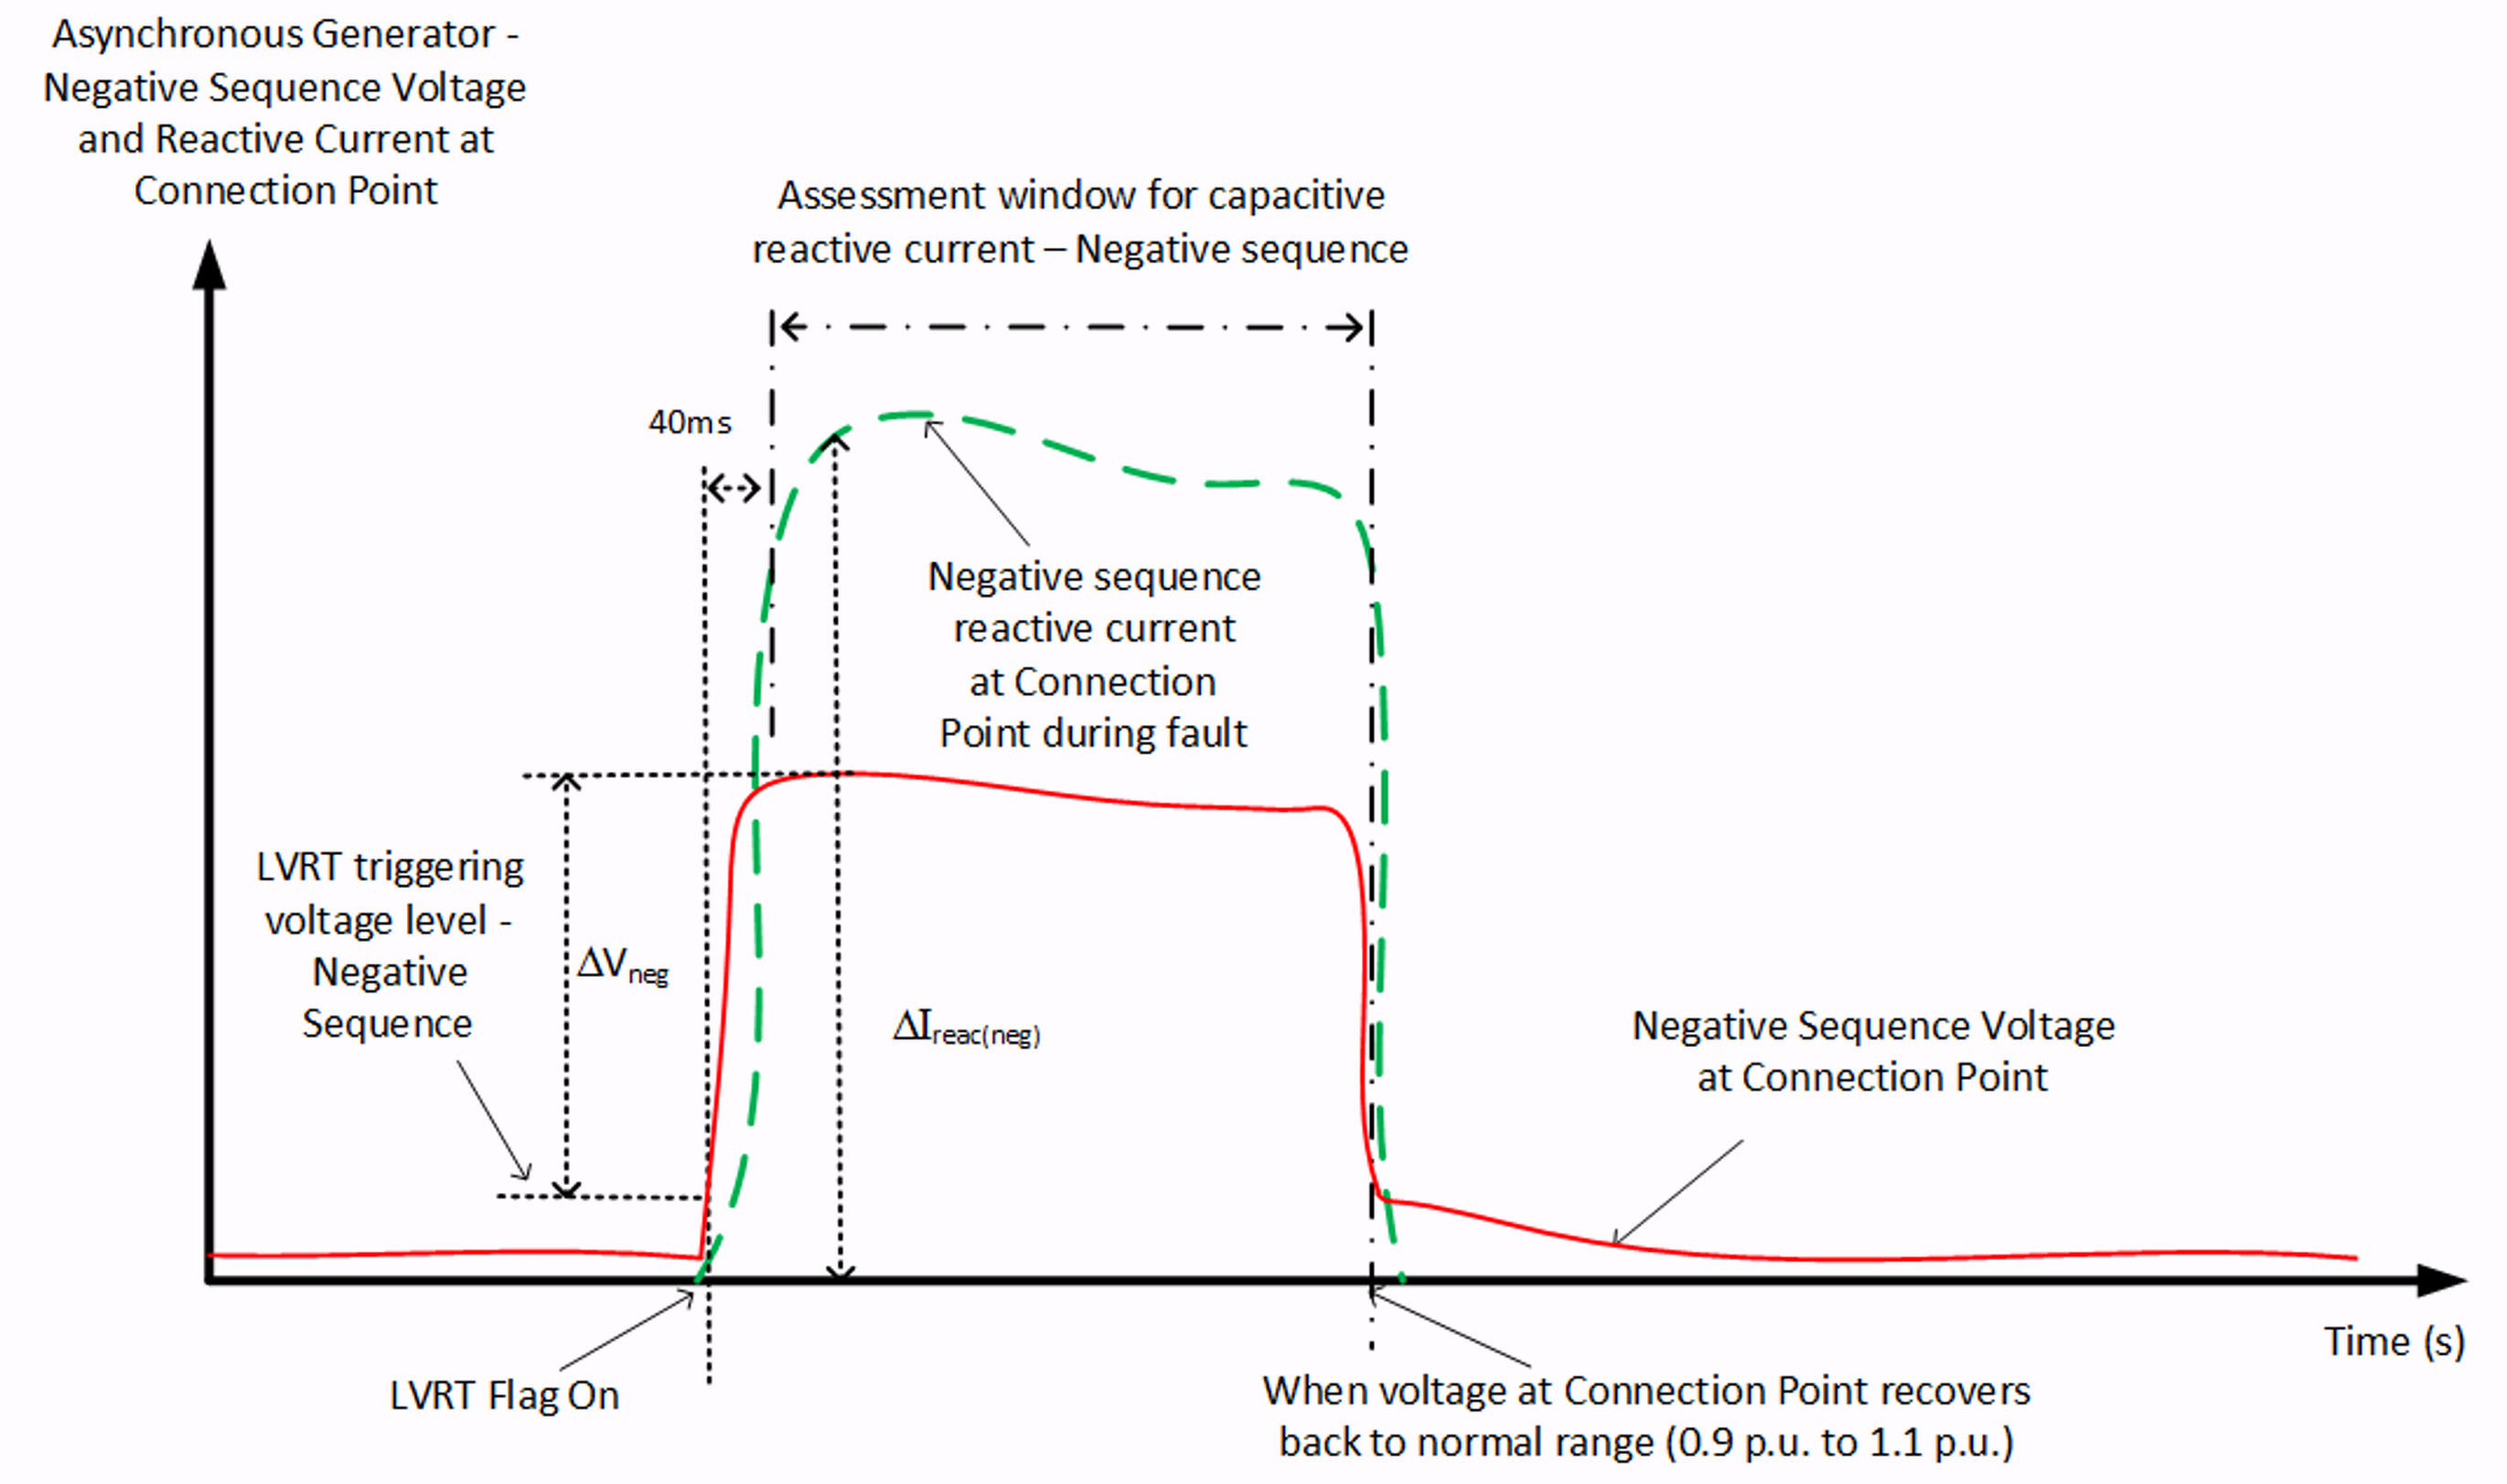
The assessment window begins when the positive/negative sequence reactive current reaches 90% of the peak value.
The assessment window ends when the voltage at the Connection Point is recovered back to normal range (0.9 p.u. to 1.1 p.u.) after clearance of the disturbance.
- Western Power does not ask for HVRT assessments for synchronous generating systems in A12.9.
- There are no reactive current rise/settling time calculations for synchronous generating systems in A12.9.
- PowerFactory (positive-sequence reactive current): Studies use a balanced RMS simulation, which is positive-sequence only.
- Damping of oscillatory reactive current: Per the Power System Stability Requirements Guideline ([5]), oscillations should have damping ratio ≥ 0.1 and halving time ≤ 5 s (damping coefficient ≤ −0.14 Np/s). In this template, damping is assessed on Iqpoc from fault inception to clearance. If the response is not oscillatory, these damping metrics may not apply.
Positive-sequence Iq assessment window
Negative-sequence Iq assessment window
- Only SMIB studies have been completed. Network-wide studies may be added to further demonstrate performance.
Step 1 - Choose clearance times for "3. Under-voltage disturbances"
The default clearance time is 450 ms. You may choose a different clearance time depending on the network protection systems.
A12.10 Disturbance Ride Through for Partial Load Rejection
The purpose of A12.10 is to demonstrate your generating system's ability to maintain Continuous Uninterrupted Operation (CUO) during and following a particular power system load reduction event or a separation event with an equivalent impact.
- If your generating system is comprised of only grid-following asynchronous plant, then you could instead propose compliance with A12.10 via demonstrating compliance with A12.7. Specifically, you could assert that any system separation event, regardless of the load reduction from the pre-disturbance level, cannot exceed the frequency operating standard and ROCOF as per A12.7.
- However, if you have a synchronous plant or grid-forming inverters in your generating system, the inertia of your generating system may need to be considered in your generating system's ability to maintain continuous uninterrupted operation during a partial load rejection event.
We don't currently support network studies for PowerFactory.
A12.11 Disturbance Ride Through for Quality of Supply
The purpose of A12.11 is to confirm that your generating system does not disconnect as a result of specified voltage fluctuation, harmonic voltage distortion and voltage unbalance levels.
We don't currently provide tests for A12.11. Additionally, compliance is often demonstrated via product information obtained via your OEM.
A12.12 Quality of Electricity Generated
The purpose of A12.12 is to confirm that your generating system's output does not exceed specified voltage fluctuation, harmonic voltage distortion and voltage unbalance limits.
We don't currently provide tests for A12.12.
A12.13 Generation Protection Systems
The purpose of A12.13 is to confirm that your generating system has adequate protection systems.
We don't currently provide tests for A12.13. Additionally, compliance is often demonstrated via design reports.
A12.14 Remote Monitoring Requirements
The purpose of A12.14 is to confirm that your generating system has adequate remote monitoring.
We don't currently provide tests for A12.14.
A12.15 Remote Control Requirements
The purpose of A12.15 is to confirm that your generating system has adequate remote control.
We don't currently provide tests for A12.15.
A12.16 Communications Equipment Requirements
The purpose of A12.16 is to confirm that your generating system has adequate communications equipment.
We don't currently provide tests for A12.16.
A12.17 Generation System Model
The purpose of A12.17 is to ensure the accuracy and robustness of the generating system's model. You should ensure that your models meet the requirements of [4]. Where possible, we have included tests to assess the compliance of your model.
Assumptions
- Generally, Ideal Generator Performance Standard is assumed for all tests and Analysis Nodes within the template.
- The template has primarily been configured for asynchronous intermittent generating systems. Additional tests required for synchronous generating systems have been included and disabled by default.
- By default, the selected number of loops (i.e. operating conditions and/or test variations) is a subset of the required tests in an effort to reduce simulation time when getting initial results. For submission, you may want to select a greater number of loops.
Sources
- [1] Western Power | Wholesale Electricity Market Rules (WEM Rules) | 1 April 2024
- [2] Western Power | Generator Performance Standards: Guideline for the Assessment of Technical Requirements | Version 2 | 30 January 2023
- [3] Western Power | Technical Rules | Revision 3 | 1 December 2016
- [4] Western Power | Facility Model Guidelines - Transmission Grid Strategy and Planning | Revision 1 | 30 April 2024
- [5] Western Power | Power System Stability Requirements Guideline | 11 May 2021
Revision history
Version 8 | 12 May 2026
Improvements- A12.2 Active Power Capability assessment: added a temperature-dependency example; added a table comparing static and dynamic results per Western Power requirements; PowerFactory Static Node
1014now uses the disaggregated PowerFactory model instead of the aggregated model. Added another loop to allow for assessment at another ambient temperature. - A12.3 Reactive Power Capability assessment: added a temperature-dependency example.
- A12.9 Disturbance Ride Through for Multiple Disturbances: Major update, entirely new methodology for delta Iq and delta V assessment. Added negative sequence reactive current assessment for synchronous generating systems.
- A12.9 Series of disturbances: Added PowerFactory Dynamic Node to the assessment.
- Added axes lines to Plot Node
1056. - Improved styling of P(f) droop curves, Plot Nodes
1155and1173. - Improved styling of Iq injection curve, Plot Nodes
1427and1441. - Updated active power recovery calc, rise time calc, settling time calc,
ADVOUTPUTin Plot Nodes1428,1580,1460to be dependent on the duration of the fault disturbance. - Added fault duration loop variable to Loop Start Node
1437. - Updated plotting to use SIM_END rather than the specific simulation end time to give users more flexibility in the plotting times.
- Removed suffix of .csv from output file names for Table Nodes.
- Output files are grouped under requirement-specific subfolders (for example
A12.1) instead of a single shared GPS folder.
- Updated title of Q(V) droop curve in Plot Node
1056. - Updated title of Plot Node
1616to reference PowerFactory rather than PSS®E. - Updated title of Plot Node
1389to refer to test A12.8 rather than A12.7. - Updated references/titles from PSCAD to PSCAD™.
- Updated title of Plot Nodes
1618and1619to refer to test A12.9 rather than 12.9. - Updated Loop Start Nodes
1399and1485to refer to ±0.484 rather than ±0.395.
Version 7 | 30 January 2026
Improvements- Added Action Nodes.
- Replaced deprecated
RISE_T,SETTLE_T,COMMENCEMENT_Tcommands in all Plot Nodes withRISE_TIMEandSETTLING_TIMEcommands.
- 12.3 Reactive Power Capability: Changed
CONTROLcommand for controlling the Thévenin equivalent generator to aSETcommand as per latest updates to WECC solar model. - 12.4 Minimum equivalent gain: Removed excessive
TAT=arguments inADVBANDScommands in Plot Node1124. - 12.5 Active Power Control: Removed excessive
TAT=arguments inADVBANDScommands in Plot Node1134. - 12.7 Ride Through for a Frequency Disturbance: Fixed
TAT=arguments inADVBANDScommands to align with the time at which frequency disturbances occur in Plot Node1248.
Version 6 | 16 April 2025
Fixed- Added missing Internode Variable for HVRT flag output in Node
1410. - Added missing Internode Variable for LVRT flag output in Node
1416. - Fixed incorrect Internode Variable name in Analysis Node
1413for LVRT entry/exit voltages. - Fixed incorrect Internode Variable name in Analysis Node
1415for HVRT entry/exit voltages.
Version 5 (v1.4.20) | 21 January 2025
- Updated descriptions in template for Nodes, Plot subtitles and file names to better describe tests.
- A12.9 FRT transition bands: Split the Plot Nodes which were calculating the LVRT and HVRT enter/exit times so that there is one per power systems software (i.e. PowerFactory and PSCAD™). There was an error where the LVRT and HVRT enter/exit times were only calculated in PSCAD™ and these values were used to output the Vpoc values for both PowerFactory and PSCAD™.
- A12.4: Error bands on reference step into limiter tests had incorrect
AT=arguments:TAT=25, TAT=35.
Version 4 (v1.4.16.6) | 23 September 2024
- 12.9: i_iq_settling_time calculation during faults incorrectly had END_T argument as 15 seconds. This was changed to 5.449 so that the settling time value is calculated within the applied disturbance duration.
Version 3 (v1.4.16) | 27 August 2024
- Included tests for Synchronous Generating Systems.
Version 2 (v1.4.15) | 28 June 2024
- A12.3: Update Plot subtitle to include description of Pref and Qref.
Version 1 (v1.4.14) | 29 May 2024
- First release