Template: AEMO Dynamic Model Acceptance Tests (DMAT)
Template version: v17
Country:

AU
Software required:

How to add this template to your project
- From within your gridmo project, open the flow dropdown and select 'Add flow'.
- Select the template you want to use and click 'Add to project'.

Background
The number and complexity of user models have increased during the energy transition. In an effort to ensure models are "usable..., numerically robust, and represents the installed plant...", AEMO requires proponents to meet a collection of requirements and complete a series of Dynamic Model Acceptance Tests - collectively referred to as "DMAT".
Importantly, DMAT does "...not assess compliance of any given plant with performance or access standards at its connection point". Although DMAT can often reveal potential plant performance issues, it is not an assessment of those performance issues. Instead, it is an assessment of the models themselves.
"Table 22 DMAT" refers to a subset of DMAT known as ""Minimum Mandatory DMAT"" and represents a "list of minimum mandatory tests". "Full DMAT" refers to completing all of DMAT. The gridmo template can be configured to run either "Table 22 DMAT" or "Full DMAT" by enabling/disabling loops - noting that the Loop Variable l_is_full_or_t22 has been created to distinguish Table 22 (T22) tests easily.
Reference
Common assumptions
- Supporting documentation like Releasable User Guides (RUGs) etc are required as part of the DMAT and are not included in this template.
- AEMO DMAT requires dynamic data to be provided as a per unit value on the machine's MVA base - however, based on our experience, our template has been configured for the more common units used in DMAT submissions, such as: Voltage [p.u.], Active power [MW], Reactive power [MVAr], Iq [p.u. on machine base], Frequency [Hz], Angle [degrees].
- The template has primarily been configured for asynchronous generating systems.
- Some test numbers actually require multiple different tests. For example, Table 4 test 37 must be completed at SCR=10, X/R=14 and SCR=POC, X/R=POC. In such instances, we have included suffixes on the test numbers such as 37A and 37B.
- Where relevant, we have included extra PSS®E Nodes which are used to show what test was applied with your generating system out of service. These are indicated by the Node description, "Generate applied test".
- By default, all Plot Nodes are configured to benchmark PSS®E and PSCAD™ results. This is the recommended approach due to its simplicity. If desired, you can enable the PSCAD™ only and PSS®E only Plot Nodes to submit separate DMAT reports for each software package. For these benchmarked plots, we have used the ADVBANDS error bands to assess model alignment. DMAT does not explicitly mention how model alignment should be assessed and therefore we have chosen to use the same error band requirements outlined in the AEMO Power System Model Guidelines for R2 overlays between real data and power systems software.
- For some tests, AEMO DMAT states "In the event the SCR values are expected to be lower at the generating system’s or integration resource system’s connection point, then the expected SCR values for system normal and the most severe credible contingency should be used" or similar. We have assumed this means that if your project specific minimum SCR is less than 3, then the project minimum SCR should be used for all tests which require SCR=3. This can be configured in the template using the Global Variable
au_aemo_dmat_scr_min.
Source energy helper
Some tests in this template require the generator under test's source energy to be varied (where source energy is solar irradiance, wind speed etc.) Specifically, this template requires the source energy to be varied such that available active power can be limited to values such as 100%, 80%, 70%, 60%, 50%, 40%, 30% and 5%. The relationship between source energy and terminal active power [MW] of a generating unit is typically non-linear and may be specific to particular OEM models, especially for PSCAD™ wind turbine models (i.e. wind speed v.s. active power).
Helper 1: Source energy (Node 1175) has been provided in the template to help you understand the relationship between source energy and terminal active power [MW] of a generating unit. We recommend running the source energy helper Run, which loops over different source energy values using the Loop Variable l_se_step. You need to update the values of l_se_step depending on the PSCAD™ model source energy requirements and units. Some common options may be:
l_se_step[p.u.] (Default in template): Source energy is expressed in per unit on machine base. Loop over values from 0 to 1.l_se_step[W/m2]: Source energy is irradiance and expressed in W/m2. Loop over values from 0 to 1000.l_se_step[m/s]: Source energy is wind speed and expressed in m/s. Loop over values from 0 to 40.
The output of the source energy helper Run is a scatter plot and spreadsheet which provides the relationship between terminal active power [MW] of the generating unit and source energy. Once you understand the relationship between source energy and terminal active power [MW], update the relevant Loop Variables in the following Loop: Start Nodes:
- Loop: Start Node 1387
- Loop: Start Node 1392
- Loop: Start Node 1450
Table 2 (Tests 0.1 - 0.5): Flat run, snapshot and initialisation
The purpose of Table 2 is to demonstrate your model's ability to run a long flat run in a robust manner, initialise in < 3 seconds, and accommodate the snapshot functionality.
We recommend running a broader range of operating conditions to confirm initialisation in < 3 seconds (e.g. Pmin/Pmax, Qmin/Q0/Qmax, SCRmin/SCRmax, X/Rmin/X/Rmax). For such tests, see our Model setup template.
Table 3 (Tests 1 - 36): Balanced faults
The purpose of Table 3 is to demonstrate your model's robustness across a range of operating conditions and balanced faults.
The AEMO methodology for defining contingencies is often to define the fault impedance as a ratio of the Thévenin equivalent source impedance, Zthev (e.g. Zf=Zs in Table 3 of DMAT or Rf = Grid_R% * Rthev and Xf = Grid_X% * Xthev in the AEMO PSS®E v34-v36 Benchmarking Requirements).
This methodology does not consider Vthev and therefore the observed connection point residual voltage (Vf) may change significantly depending on the steady state initial conditions and the subsequently calculated Vthev value. Having the residual voltage of the test change depending on initial conditions can be undesirable during review, especially for low SCR operating conditions where the observed effect is greater.
Rather than specifying a ratio of fault impedance to Thévenin equivalent impedance, it is common industry practice to instead specify a target residual voltage. Therefore, the fault impedance calculation will take into account the steady state initial conditions and the subsequently calculated Vthev value (see Udip in Equation (1) of the AEMO DMAT Guideline). Therefore, we have specified particular residual voltages for each contingency, noting that we are still observing the desired Xf/Rf ratio.
Table 4 (Tests 37 - 120): Unbalanced faults
The purpose of Table 4 is to demonstrate your model's robustness across a range of operating conditions and unbalanced faults.
Table 5 (Tests 121 - 125): Unbalanced MFRT
The purpose of Table 5 is to demonstrate your model's robustness across different balanced and unbalanced MFRT sequences.
Sequence S1 is a pre-determined series of faults. In accordance with the AEMO requirements, we generated sequences S2 to S5. These sequences are deterministic and are detailed in the MULTIFAULT Command.
AEMC ERC0393 changed the definition of a 'disturbance' in the National Electricity Rules (NER). That change was mandatory for new generating system connections from late August 2025 onward.
The new definition is: A disturbance is defined to have ended 20 milliseconds after the voltage at the connection point recovers to within 0.90-1.10 pu. This means that the minimum time between disturbances in a multiple fault ride-through sequence is now effectively 20 milliseconds.
However - as the AEMO DMAT document has not been updated with this new definition, we have not yet updated the AEMO DMAT template for this requirement.
However, a new optional argument MIN_TIME_BETWEEN_FAULTS= has been added to the MULTIFAULT command. Adding MIN_TIME_BETWEEN_FAULTS=0.02 to the MULTIFAULT command will shift the fault inception times to space subsequent faults by at least 20 ms.
Table 6 (Tests 126 - 130): Balanced MFRT
The purpose of Table 6 is to demonstrate your model's robustness across different balanced MFRT sequences. As the faults are balanced, the plots are benchmarked with PSS®E and PSCAD™ by default.
In accordance with the AEMO requirements, we generated sequences P1 to P5. These sequences are deterministic and are detailed in the MULTIFAULT Command.
In accordance with section 3.2.8, if protection tripping is not captured by the MFRT sequences and explicit confirmation of protection is required, use the part of S5.2.5.4 of the AEMO Generator Performance Standards (GPS) template which causes UV and OV trips.
Table 7 (Tests 131 - 148): TOV
The purpose of Table 7 is to demonstrate your model's robustness across different temporary over voltage (TOV) tests.
TOV methodology - Capacitor v.s. playback
AEMO states the methodology for Table 7 tests whereby "the test case is carried out via application of a switched shunt (capacitive) element at POC". This methodology is enabled by default. However, some engineers prefer to use a voltage source playback rather than a capacitor switch-in for TOV tests. Therefore, we have provided this alternate methodology and disabled it by default.
There are pros and cons of each methodology:
- Via capacitor: This is the methodology outlined in the DMAT document. This methodology helps to avoid using a Thévenin equivalent voltage source playback for very high voltage dips which has been known to cause unrealistic and undesirable generating systems responses.
- Via playback: This methodology avoids large transients when the capacitor is switched in and switched out and can be therefore easier to determine model robustness for such overvoltages.
Table 8 (Tests 149 - 166): Vref, Vgrid, Qref and PFref steps
The purpose of Table 8 is to demonstrate your model's ability to operate in different reactive power control modes.
- Figure 3 is assumed to refer to Thévenin equivalent voltage source steps (i.e. Vgrid).
- Figure 4 y-axis, "Reactive Power Reference [pu]" is assumed to have a base unit of the generating system rated active power [MW].
- Tests 161 - 166 are conducted for both fixed reactive power control mode and power factor control mode.
- Tests 155 - 166: We assume that the initial connection point voltage is 1.0 p.u. rather than default connection point voltage. The note, "Voltage Reference is applied as a relative change (whereas the figure indicates an absolute change from 1.0 pu) from the starting voltage reference of the plant or production unit controller, taking into account system strength, reactive power flow and the droop functionality" is ambiguous since it only refers to the Vref test and not the Vgrid/Qref/PFref tests.
Table 8 specifies to conduct the test "as per Fig 4" which has a note that states, "For PF tests, appropriate PF control setpoint is to be issued to achieve (at least) targeted 0.3 pu change in the reactive power output."
Thus, we need to choose a power factor which is equivalent to a Qref step change size of +/- 0.3 pu on project rated active power base. For example, for Test 161 where active power is 1 pu or Test 162 where active power is 0.05 pu, the power factor would be:
Table 9 (Tests 167 - 169): Pref steps
The purpose of Table 9 is to demonstrate your model's ability to operate in active power control mode.
In accordance with section 3.2.11, you must choose the time between Pref steps such that "the timing is expected to be of sufficient duration to allow reduction to occur". Some generating systems may require longer times between Pref steps. The required timing will depend on your active power control mode gains as well as your ramp up and ramp down control limits (e.g. expressed in MW/sec). If required, edit the simulation time of the relevant PSS®E Dynamic, PSCAD™ and Plot Nodes.
Table 10 (Tests 170 - 177): Frequency ramps
The purpose of Table 10 is to demonstrate your model's ability to operate in frequency control mode.
Tests 170 - 173: Figure 7 contains 4 grid frequency ramp profiles which are designated with the following test number suffixes:
- A: 4 Hz/s ramp to 52Hz.
- B: 4 Hz/s ramp to 51.75Hz.
- C: 4 Hz/s ramp to 51.5Hz.
- R: 2/3 Hz/s ramp to 52Hz (i.e. "...frequency reaching 52 Hz over 3 seconds").
We assume that tests A and R are required as part of Table 22.
Tests 174 - 177: Figure 8 contains 2 grid frequency ramp profiles which are designated with the following test number suffixes:
- A: 4 Hz/s ramp to 47Hz.
- R: 1 Hz/s ramp to 47Hz (i.e. "...frequency change of 1 Hz/second over 3 seconds").
We assume that tests A and R are required as part of Table 22.
Table 11 (Tests 178 - 189): Grid voltage changes
The purpose of Table 11 is to demonstrate your model's ability to respond to grid voltage changes.
Figure 10: The figure shows three different test methodologies and we have included each methodology (e.g. Test 186A-10 is Test 186 with the first X/R configuration and 10% extended dip grid voltage recovery).
- Tests 186 - 189: The extended dip grid voltage recovery is created through a combination of two events. This methodology helps to avoid using a Thévenin equivalent voltage source playback for very low voltage dips (e.g. 10%) which has been known to cause unrealistic and undesirable generating systems responses. The two events are:
- A fault impedance applied at 5 seconds for a duration of 500ms.
- A Thévenin equivalent voltage source playback ramp at 5.5 seconds for a duration of 1 second.
Table 12 (Tests 190 - 192): Grid oscillation rejection
The purpose of Table 12 is to demonstrate your model's ability to reject grid voltage amplitude and phase oscillations.
- Test 192: Note 26 states that "The upper frequency at which tests would be conducted will depend on the control system bandwidth and may need to cover up to and including nominal frequency. At least tests up to 20Hz shall be performed as a minimum in all circumstances". However, Table 22 states "...up to and including 25Hz [are to be completed]". We have assumed that tests up to 25Hz are required as part of Table 22.
Amplification factor
To measure the impact of the generator's response to the voltage oscillation, the amplification factor is calculated at multiple test frequencies. The amplification factor at each frequency is defined as the ratio of:
- The magnitude of the voltage oscillation with the presence of the proposed generating system; to
- The magnitude of the voltage oscillation without the presence of the proposed generating system (i.e. the magnitude of the injected voltage oscillation).
An amplification factor greater than 1 means that the generating system is amplifying the injected voltage oscillation, whereas a value less than 1 means that the generating system is attenuating the injected voltage oscillation.
In this template, we have provided two methodologies to calculate the amplification factor - the 'engineering' methodology and the 'theoretical' methodology:
- Engineering methodology: The amplification factor considers the peak to peak values of Vpoc.
- Theoretical methodology [Powerlink default methodology]: The amplification factor only considers the oscillation magnitude at the frequency of the injected voltage oscillation signal. The impact of other induced frequencies are not considered.
For some plant responses, the two methodologies can have very different results. Consider the following example:
- A 10 Hz voltage oscillation is injected. The plant attenuates the 10Hz oscillation very well.
- Unfortunately, the 10Hz oscillation induces a 1Hz voltage oscillation which has a large amplitude.
As shown in the image below, the 'engineering' methodology considers the peak to peak of the entire channel, irrespective of the injected oscillation frequency. Therefore, the amplification would be quite large. In contrast, the 'theoretical' methodology only considers the peak to peak of the injected oscillation frequency. Therefore, the amplification factor would be quite small.
We recommend using both methodologies in addition to reviewing the time series plots to gain a complete understanding of your generator's response to the voltage oscillation.
Table 13 (Tests 193 - 198): Grid voltage angle changes
The purpose of Table 13 is to demonstrate your model's ability to respond to grid voltage angle changes.
For SMIB studies, we set the Thévenin equivalent voltage source angle as the 0° reference. Therefore, the initial angle at the POC will not be 0° for initial conditions where there is significant active and reactive power flow across the Thévenin equivalent impedance (e.g. Ppoc = 1 pu).
- In accordance with Note 29, we have split each test event "Grid voltage angle change equal to ±40° and ±60°" into four different dynamic simulations, rather than having a single dynamic simulation with multiple subsequent angle changes (i.e. the tests are "treated as standalone steps"). This helps users isolate and resolve issues as well as decrease simulation time due to better simulation parallelization capability. The four tests are designated by the following:
- P40: Positive 40 degrees (+40°)
- P60: Positive 60 degrees (+60°)
- N40: Negative 40 degrees (-40°)
- N60: Negative 60 degrees (-60°)
Table 14 (Test 199): Pref steps - SCR=1
The purpose of Table 14 is to demonstrate your model's ability to output active power under very low grid SCR conditions. For many generating system technologies "it is expected that the plant is unable to maintain stable operation at 100% output level". Table 14 investigates at which point this instability may occur.
Some generating systems may require longer times between Pref steps. The required timing will depend on your active power control mode gains as well as your ramp up and ramp down control limits (e.g. expressed in MW/sec). If required, edit the simulation time of the relevant PSS®E Dynamic, PSCAD™ and Plot Nodes.
Section 3.2.17 implies that both PSS®E and PSCAD™ simulations are required for this test. However, we note that PSS®E may be very unstable at an SCR of 1.0 for some models. We therefore assume that this test is a PSCAD™ only test. However, a pre-configured (but disabled by default) PSS®E test is included.
Table 15 (Tests 200 - 205): Balanced faults - SCR=1
The purpose of Table 15 is to demonstrate your model's fault ride through capability under very low grid SCR conditions. For many generating system technologies "It is expected that the plant/model performance would not be able to sustain operation at SCR = 1".
- The requirement methodology is unclear. The test description requires "pre-disturbance SCR conditions are lowered to SCR=1" but the contents of Table 15 outlines pre-fault and post-fault SCR, implying post-disturbance SCR conditions are lowered to SCR=1. We have assumed the latter.
- Section 3.2.18 implies that both PSS®E and PSCAD™ simulations are required for this test. However, we note that PSS®E may be very unstable at an SCR of 1.0 for some models. We therefore assume that this test is a PSCAD™ only test. However, a pre-configured (but disabled by default) PSS®E test is included.
Table 16 (Tests 206 - 225): Balanced faults
The purpose of Table 16 is to demonstrate your model's robustness across a range of operating conditions and balanced faults.
- Table 22 is unclear on what initial reactive power tests should be included as part of Table 22. It only states that tests 206-225 are required. We assumed that Q = 0 MVAr operating condition tests are required for Table 22 DMAT and Qmax/Qmin operating condition tests are only required for Full DMAT. Additionally, we have assumed Q = ±0.3 MVAr for Qmax/Qmin in accordance with the comment, "In absence of specific levels, +0.3pu and -0.3pu could be used".
Table 17 (Tests 226 - 229): Source energy changes
The purpose of Table 17 is to demonstrate your model's ability to consider source energy changes.
The requirement methodology is unclear for Tests 228 and 229 where the description requires a change in source energy "from reduced output levels". There are two alternative interpretations which are detailed below. We have assumed Methodology 1 by default. However, Methodology 2 is simpler and may be required for some OEM PSS®E models which are not capable of initialising at a source energy which is different from the associated Pref value.
- Methodology 1 [Default]
- Methodology 2
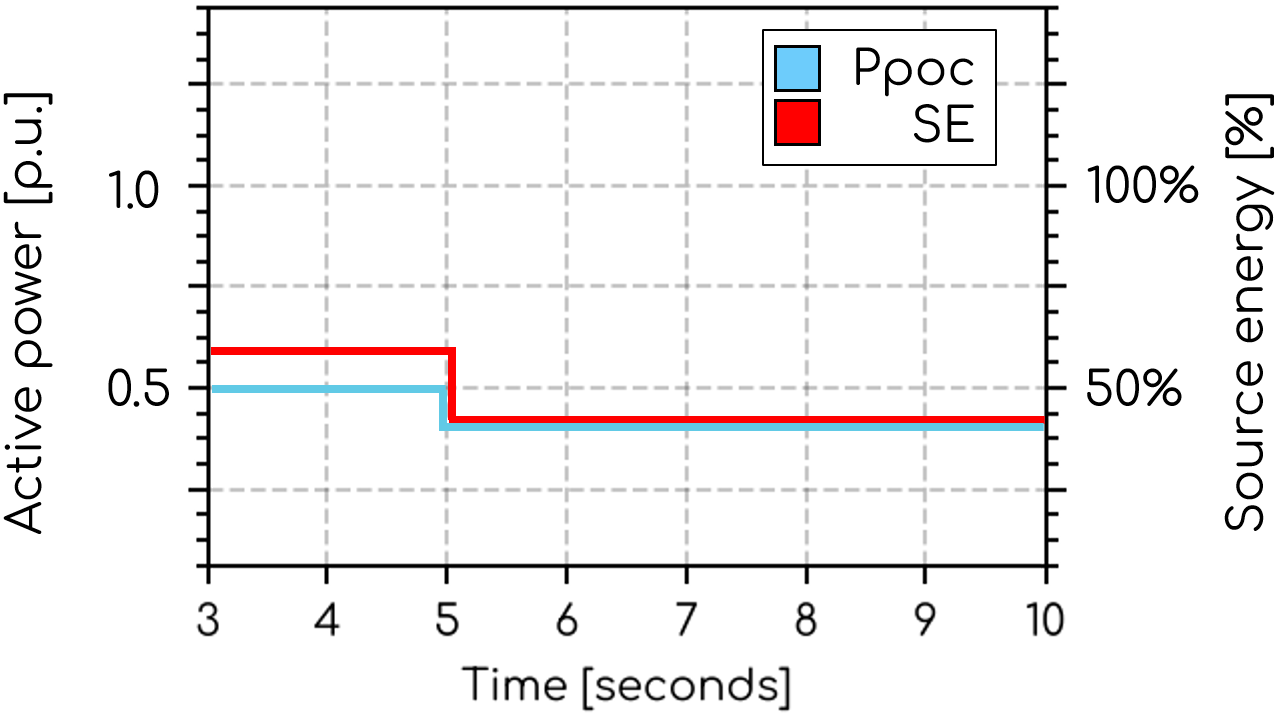
Test 228: The initial source energy chosen to represent "from reduced output levels" is 40% with a +20% step to 60%. This methodology tests both that Ppoc is initially being limited to ≈0.4 p.u. even though Pref is 0.5 p.u. and that the Ppoc only rises to 0.5 p.u. even though the source energy available rises above the Pref value.
Test 229: The initial source energy chosen to represent "from reduced output levels" is 60% with a -20% step to 40%. This methodology tests both that Ppoc is only 0.5 p.u. despite source energy available beyond the Pref value of 0.5 p.u. and that Ppoc is being limited to ≈0.4 p.u. even though Pref is 0.5 p.u.
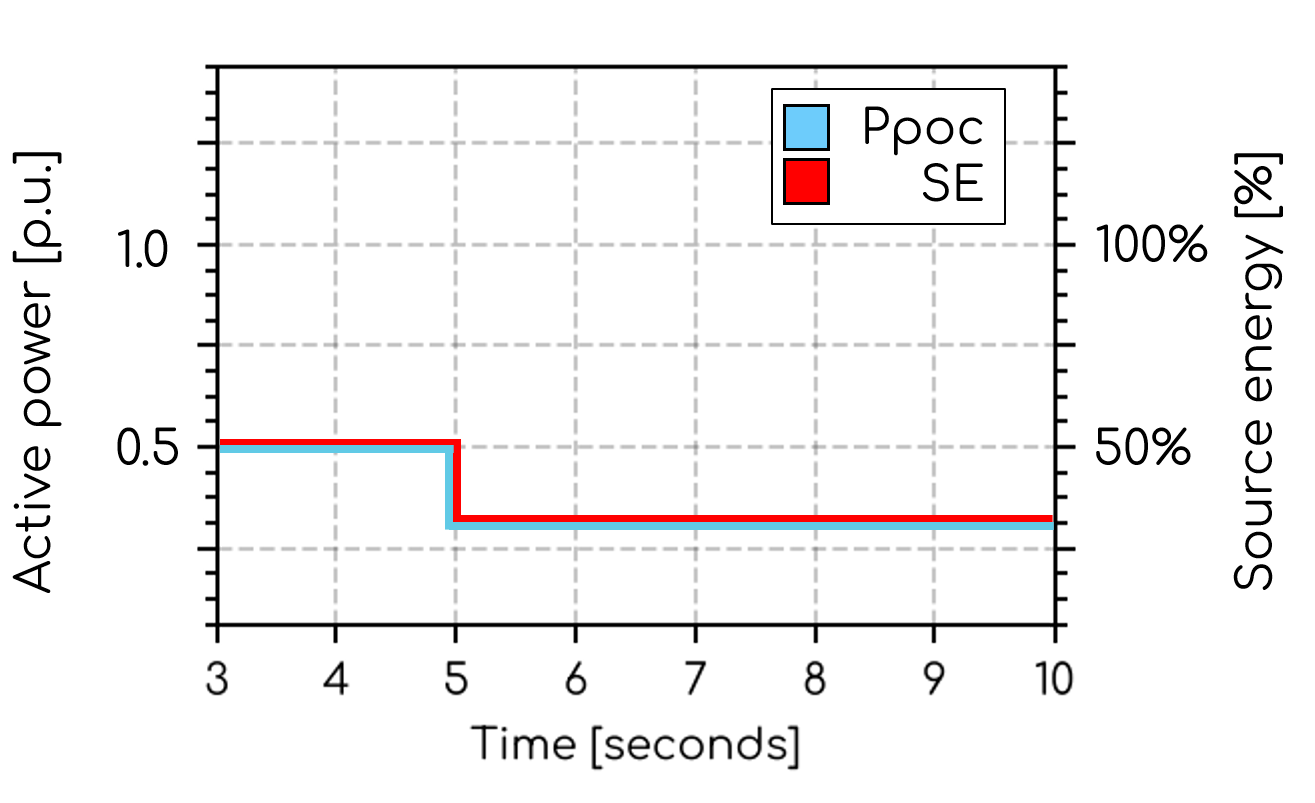
Test 228: The initial source energy chosen to represent "from reduced output levels" is 50% with a +20% step to 70%. This methodology tests that Ppoc doesn't rise from 0.5 p.u. even though the source energy available rises above the Pref value.
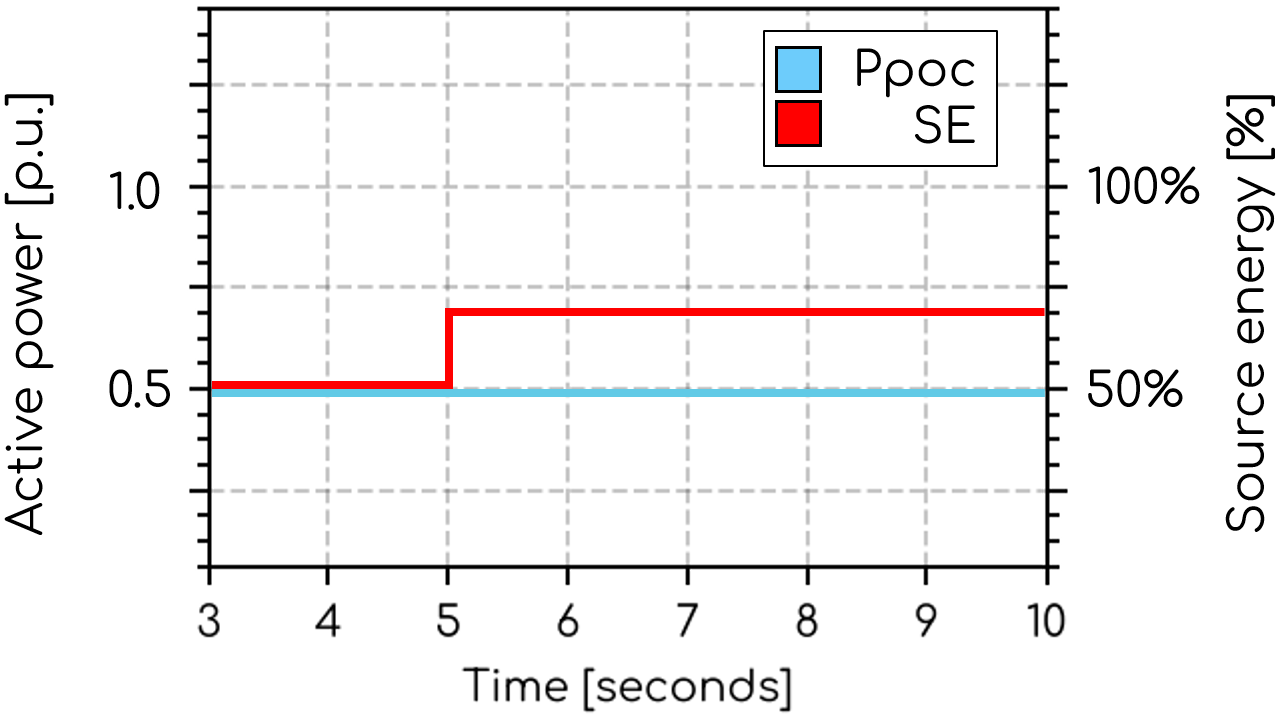
Test 229: The initial source energy chosen to represent "from reduced output levels" is 50% with a -20% step to 30%. This methodology tests that Ppoc is being limited to ≈0.3 p.u. even though Pref is 0.5 p.u.
Section 3.3: IBR - LVRT/HVRT studies
Vgrid steps showing LVRT/HVRT transition bands isn't currently in this template. If required, use the S5.2.5.5 LVRT/HVRT transition band tests from the NER Chapter 5 Typical Generator Performance Standards (GPS) template.
Section 3.4: IBR - Grid voltage changes at reduced source energy
Figure 3 (Vgrid steps) at reduced source energy isn't currently in this template. If required, duplicate 'Table 8 (Tests 155 - 160): Vgrid steps' in this template and modify the Loop Variables as required.
Section 3.5: IBR - Minimum SCR verification
Verification of minimum declared SCR isn't in this template. We have assumed this has been superseded by SSIAG requirements. See the System Strength Impact Assessment Guidelines (SSIAG) template.
Section 3.6: Synchronous machines
The purpose of Section 3.6 is to demonstrate your model's excitation limiters. In the absence of explicit test numbers for this section, we have created the following test numbers:
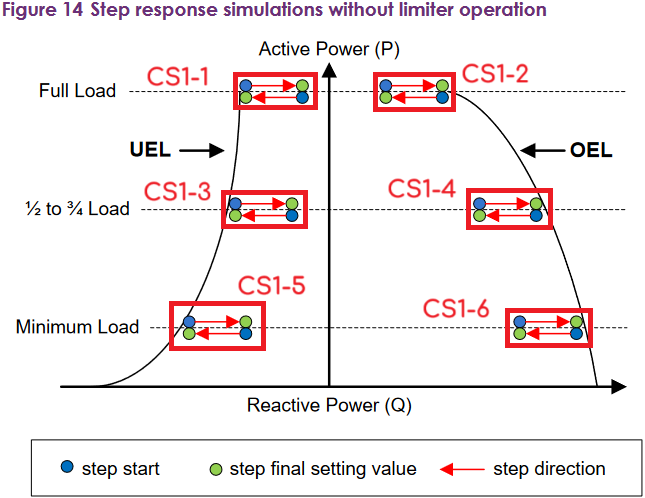
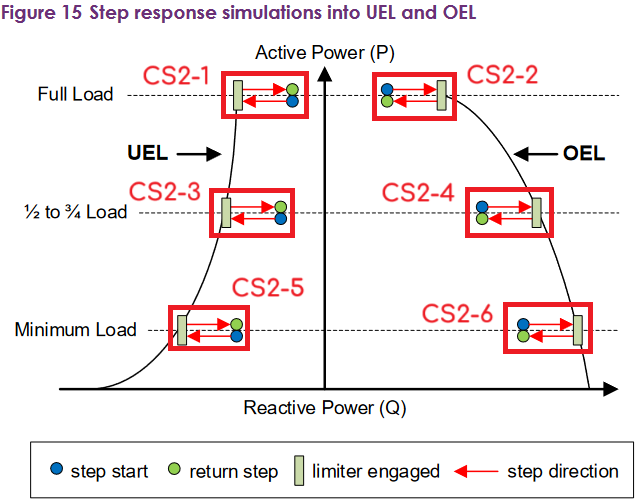
Choosing initial Qpoc values for Case study 1 and Case study 2
Choose initial Qpoc values for Case study 1 which correspond to the following operating conditions:
- Qpoc "starting from within the generator’s capability curve...[where] the final settling value [from a -5% Vref step] should be just within the UEL and should not enter into any limiter, including the UEL". The default value is -0.05 [p.u.].
- Qpoc "starting from within the generator’s capability curve...[where] the final settling value [from a +5% Vref step] should be just within the OEL and should not enter into any limiter, including the OEL". The default value is +0.05 [p.u.].
The values should be chosen based on the generating system capability curve and excitation limiter configuration. These values should be inserted into column l_qcmd in Loop: Start Node 1792.
Choose initial Qpoc values for Case study 2 which correspond to the following operating conditions:
- Qpoc starting from within the UEL where a -/+5% Vref step "engages and disengages the limiter action". The default value is -0.2 [p.u.].
- Qpoc starting from within the OEL where a +/-5% Vref step "engages and disengages the limiter action". The default value is +0.2 [p.u.].
The values should be chosen based on the generating system capability curve and excitation limiter configuration. These values should be inserted into column l_qcmd in Loop: Start Node 1781.
Choosing Pmin values for Case study 1 and Case study 2
Choose Pmin values corresponding to the generating system minimum operating limit. These values should be inserted into column l_pcmd in Loop: Start Node 1792 and Loop: Start Node 1781. The default value is 0.05 [p.u.] to be consistent with the remainder of the template even though this is most likely incorrect for synchronous machines.
- Case study 1: By assuming that the Qpoc values for "5% step in Vref starting from within the Under-excitation limiter (UEL)" and "The final settling value should be just within the UEL and should not enter into any limiter" are the same, we can complete a ±5% Vref step in a single dynamic simulation and reduce the Loop: Start Node configuration requirements. This methodology choice also maintains consistency with the methodology in Case study 2.
Section 3.7: Dynamic reactive support plant
No specific tests have been provided for dynamic reactive support plant. The template can be modified or Scenario Variables utilized to complete any additional required case studies.
Section 3.8: IBR - Ppoc=0
No specific tests have been provided for IBR operation at Ppoc = 0. The template can be modified or Scenario Variables utilized to complete any additional required case studies.
Section 3.9: Integrated resource systems
No specific tests have been provided for integrated resource systems. The template can be modified or Scenario Variables utilized to complete any additional required case studies.
Section 3.10: South Australia
No specific tests have been provided for the South Australia clauses in DMAT Section 3.10. The template can be modified or Scenario Variables utilized to complete any additional required case studies.
Section 3.11: Other technologies
No specific tests have been provided for other technologies covered in DMAT Section 3.11. The template can be modified or Scenario Variables utilized to complete any additional required case studies.
Section 3.12: Network case integration
These tests have not been included in our template as providing a plot as evidence is likely insufficient.
Sources
- AEMO | Dynamic Model Acceptance Test Guideline | Version 3.0 | 3 June 2024
- AEMO | Power System Model Guidelines | Version 2.0 | 14 July 2023
Revision history
Version 17 | 31 May 2026
Improvements- To support the growing complexity of projects and grid codes, we created a new version of the template which fully utilizes the latest features in gridmo such as:
- Global variables in loops for easier setpoint configuration
- Multiline partial command Global Variables
- Global subplots
- Operating conditions
- PSCAD™ only initialization
From this version onwards, the legacy template library version of this template is no longer maintained.
Version 16 | 13 April 2026
Improvements- Tests added for Tests 0.4 and 0.5 given using new PSCAD™ snapshot functionality.
- Subplot title of Plot Node '1319'.
Version 15 | 31 March 2026
Fixed- Table 4 (Unbalanced fault - large disturbance test cases): Removed PSS®E Dynamic Node
1864as this table is PSCAD™ only.
Version 14 | 11 January 2026
Improvements- Added Action Nodes.
- Added new Global Variable
au_aemo_dmat_scr_minwhich configures the project specific minimum SCR in the template (set to 3 by default). - General: For all tests using playback, modified the playback steps to avoid specifying an event one timestep before the intended event (e.g. 4.9999, 0 pu). Also removed any steps specified beyond the test simulation time (e.g. step at T=99 seconds, when simulation length is 50 seconds).
- Source energy helper: Added PSS®E Dynamic Node to source energy helper test.
- Table 2 (Tests 0.1 - 0.3): Added additional loops to Loop: Start Nodes
1292and1334for optional SCR and optional X/R tests. - Table 11 (Tests 186 - 189): Modified methodology for extended dip grid voltage recovery test to use 50% and 80% voltage residuals using playback only, but 10% voltage residuals are achieved using a combination of the
SIMPLEFAULTcommand and playback. - Table 12 (Tests 190 - 192): Added two methodologies for calculating amplification factor along with scatter plots to show amplification factor at different injected frequencies.
- Table 13 (Tests 193 - 198): Slightly reworded plot subtitle on Plot Nodes
1439,1490and1489fromGrid voltage angle change - $l_test_angle_step°toGrid voltage angle change of $l_test_angle_step°. - Table 17 (Tests 226 - 229): For Loop 2 (100% to 120% source energy), updated final step to change source energy to 1.2 pu by default instead of 1.0 pu.
- Table 17 (Tests 226 - 229): Removed
CONTROLcommands from Loop: Start Node1450for the Loop Variablel_test_pscad_se_stepswhich were setting source energy at 4.999 seconds, as they are not required for PSCAD™ commands.
Version 13 | 10 June 2025
Improvements- Updated documentation heading structure.
- Removed "❓OPTION:" notes in the template and made required actions clearer.
Version 12 | 29 May 2025
Improvements- Table 15 and 16 (Balanced faults): Added
low.scr.mode=yesto Advanced Parameters for SCR=1 PSS®E Static Nodes1410and1459.
- Table 8 (Vref steps): Added error bands for Pgen subplot in Plot Node
1362.
Version 11 | 28 January 2025
Fixed- Table 8 (Q control tests): Full DMAT test number
163B-Qwas incorrectly called164B-Qand had incorrect active power target (was0.05, should have been1.0). - Table 8 (Power factor control tests): Full DMAT test number
163B-PFwas incorrectly called164B-PF. - Table 8 (Power factor control tests): Full DMAT tests with active power target of
0.05p.u. had the incorrect power factor target (AEMO DMAT documentation requires the power factor target to be adjusted to achieve +/- 0.30 p.u. reactive power at the connection point, irrespective of the target active power). New Loop Variablel_pf_targetadded with correct values depending on active power target.
Version 10 | 27 November 2024
Improvements- Removed unnecessary duplicate angle change in 'Angle [degrees]' playback for PSCAD™ Node
1429and PSS®E Dynamic Nodes1431&1482in Table 13 (no change to test performance - second step does not change angle from the first step).
Version 9 | 2 October 2024
New- Section 3.6: Synchronous machine excitation limiter tests included.
- Updated descriptions in template for Nodes, Plot subtitles and file names to better describe tests.
- Updated the docs to include the background and description of tests.
- Table 3: Plot Node subtitle updates to include fault duration as Loop Variable. Updated x-axis: Min value from 4 to 3 to be consistent with other plots avoiding showing PSCAD™ initialisation. Updated x-axis: Max value extended from 7 to 10 to show more post-fault. Standardized the test length of all PSS®E and PSCAD™ Nodes to 10 seconds - the applied test PSS®E Node was unnecessarily running for 15 seconds.
- Removed ADVBANDS from subplots for Plot Nodes which are configured to output PSS®E only or PSCAD™ only.
- Table 12: HTML plots are now included for all plots. Default selection of loops was reduced for Test 192 to up to and including 20Hz in accordance with DMAT Note 26.
- Table 13: Playback updated such that if users extend the simulation time beyond 15 seconds, there will not be an angle step back down to 0 degrees - making it easier for users to extend simulation time, if required.
- Table 14: Commands to utilize smiby's auto Thévenin voltage source calculation capability were added to the PSCAD™ Node for the PSCAD™ only test. Removed unnecessary duplication of first Pref Command in the PSCAD™ Nodes. Updated x-axis: Min value from 0 to 3 to be consistent with other plots avoiding showing PSCAD™ initialisation.
- Table 15: Commands to utilize smiby's auto Thévenin voltage source calculation capability were added to the PSCAD™ Node for the PSCAD™ only test.
- Table 16: Updated x-axis: Min value from 4 to 3 to be consistent with other plots avoiding showing PSCAD™ initialisation. Updated x-axis: Max value extended from 7 to 10 to show more post-fault. Standardized the test length of all PSS®E and PSCAD™ Nodes to 10 seconds - the applied test PSS®E Node was unnecessarily running for 15 seconds.
- Table 8 (Tests 153 - 154) - Vref steps: $l_xr was updated to $min_xr from $max_xr.
- Table 11 (Test 179A) - Grid voltage changes: l_xr was updated from 3 to 14.
- Table 11 (Test 179B) - Grid voltage changes: l_scr was updated from 14 to 3.
- Table 11 (Test 183A) - Grid voltage changes: l_xr was updated from 3 to 14.
- Table 11 (Test 183B) - Grid voltage changes: l_scr was updated from 14 to 3.
- Table 17: Test 228 plot subtitle description incorrectly described the source energy step as "50% to 70%", rather than "40% to 60%". Alternate methodologies provided in the docs.
Version 8 | 15 April 2024
Improvements- Merged older DMAT (Table 22) (template T001) and full DMAT template (template T003) into a single template file.
- Updated to align with newest template Sticky Note format.
Version 7 | 20 March 2024
Improvements- Added a note saying a 300 second Run is required for tests 0.1-0.3 prior to submission.
- Shortened plot subtitles to avoid clashing with customer logos.
Version 6 | 17 October 2023
Improvements- Source energy helper updated to look at Pgen, rather than Ppoc. Scatter plot of source energy v.s. Pgen included.
- TOV tests: Replaced
TOVTESTCommands with equivalentVDISTURBANCECommands. - Voltage relative steps from % syntax to latest p.u. syntax (e.g. -10% -> -0.1 pu).
- Removed AT=0 Commands from PSS®E Dynamic and PSCAD™ Nodes where the AT=0 Command was already in a Scenario Variable. This was to avoid having duplicated AT=0 Commands.
s_psse_ss_set_plant_targetsdefault value updated for Q control at the POC wherebyVALSCALE=$g_project_max_q, QTARGET=$l_qcmdwas updated toVALSCALE=$g_project_max_p, QTARGET=$l_qcmd. This aligns with Flow part of the template which provide$l_qcmdvalues based on the project's rated active power [MW] (e.g.$l_qcmd= 0.395).
- Table 8 fixed Vref steps which should have been relative from
$g_default_poc_voltage, not start at 1.0 p.u. every time.
Version 5 | 12 September 2023
Fixed- Fixed in Node
1095(source energy, PSCAD™) the initial source energy was incorrectly not using the Scenario Variable$g_pscad_change_source_energy.
Version 4 | 1 August 2023
Improvements- Added an additional optional section using a voltage playback generator.
- Setting the QCAP values for 1.15p.u. and 1.20p.u. is no longer required (as auto calculated by gridmo). Removed QCAP helper.
- Voltage oscillation - all tests - Added additional disabled plot which overlays V and Q for two cycles as required for submissions to Powerlink QLD (Australia)
- Unbalanced faults and MFRT Benchmarking - all tests - added sub-plot level legend to identify different phase voltages
- SCR=1 P steps and T22 Row 66 (SCR=1 post fault) - all tests - disabled PSS®E Nodes incorrectly used old $_ANGLE variable
- V/Q/PF steps - all tests - removed unnecessary voltage playback data from Nodes without voltage playback
- F ramps - all tests - reduce length of subtitle to avoid clipping with customer logo
- Angle change - all tests - PSS®E only plot missing psse sub-directory in output file path
- All terminal VAL=IQ references in PSS®E Dynamic Nodes updated to new
GEN, VAL=IQCommand
Version 3 | 18 July 2023
Improvements- PSCAD™ MFRT and MFRT benchmarking tests - replaced
SIMPLEFAULTcommands with newMULTIFAULTcommand. First fault now at 5 seconds. Fixed - time spacing for first two faults in each sequence did not have spacing as per AEMO DMAT requirements. - Extended voltage recovery - tests 188-10, 188-50, 188-80, 189-10, 189-50 and 189-80 - the significant voltage dip during this test is now applied via
SIMPLEFAULT, not via external grid playback. - Source energy - tests 226 and 228 - no PSS®E Dynamic Node was previously included in this study, it has now been added. Note AEMO DMAT at time of writing is unclear if this Node is required, but it has been added for completeness.
- FRT benchmarking - all tests - reduced excess simulation time on PSCAD™ and PSS®E Dynamic Nodes (excess time was beyond end of plot), reducing simulation time
- Source energy - all tests - reduced excess simulation time on PSCAD™ and PSS®E Dynamic Nodes (excess time was beyond end of plot), reducing simulation time.
- All plots from this template now save to a DMAT sub-directory.
- All helper plots from this template now save to a helpers sub-directory within the DMAT directory.
- Added PSS®E only and PSCAD™ only plots (normally disabled) instead of just benchmarking plots. These files are in individual sub-directories psse and pscad respectively.
- PSCAD™ unbalanced faults - tests 85A, 85B, 91A and 91B - plots were incorrectly labelled as 0% residual voltage, but the test is instead a bolted (0 ohm) line-line fault.
- Test 0.3's PSCAD™ Node was incorrectly labelled as test 0.4.
Version 2 | 4 July 2023
Fixed- Added missing PSCAD™ Q=0 command in Q control steps tests.
Version 1 | 27 June 2023
- First release