Template: AEMO Generator Performance Standards (GPS)
Template version: v5
Country:

AU
Software required:

How to add this template to your project
- From within your gridmo project, open the flow dropdown and select 'Add flow'.
- Select the template you want to use and click 'Add to project'.
Before running this template, complete the following:
- Configure your Global Variables and Scenario Variables using gridmo's Model setup template.
- Add this template to your project. Follow the below GPS-requirement-specific configuration steps.
Background
The number and complexity of generation interconnections have increased during the energy transition. In an effort to ensure the adequate performance of generating systems and to ensure efficient design principles by utilising standards where possible, the AEMC established Technical Requirements in the National Electricity Rules. AEMO requires proponents to show compliance with these Technical Requirements (i.e. NER S5.2.5), as well as other requirements, and establish access standards - collectively referred to as "Generator Performance Standards (GPS)". This template includes a selection of tests to demonstrate compliance with these "Generator Performance Standards (GPS)".
This template is based on the requirements of v234 of the National Electricity Rules in accordance with the Final Determination of AEMC Rule Change ERC0393, released on 22 May 2025. ERC0393 represents one of the most significant changes to Australian grid connection requirements since ERC0222 in 2018.
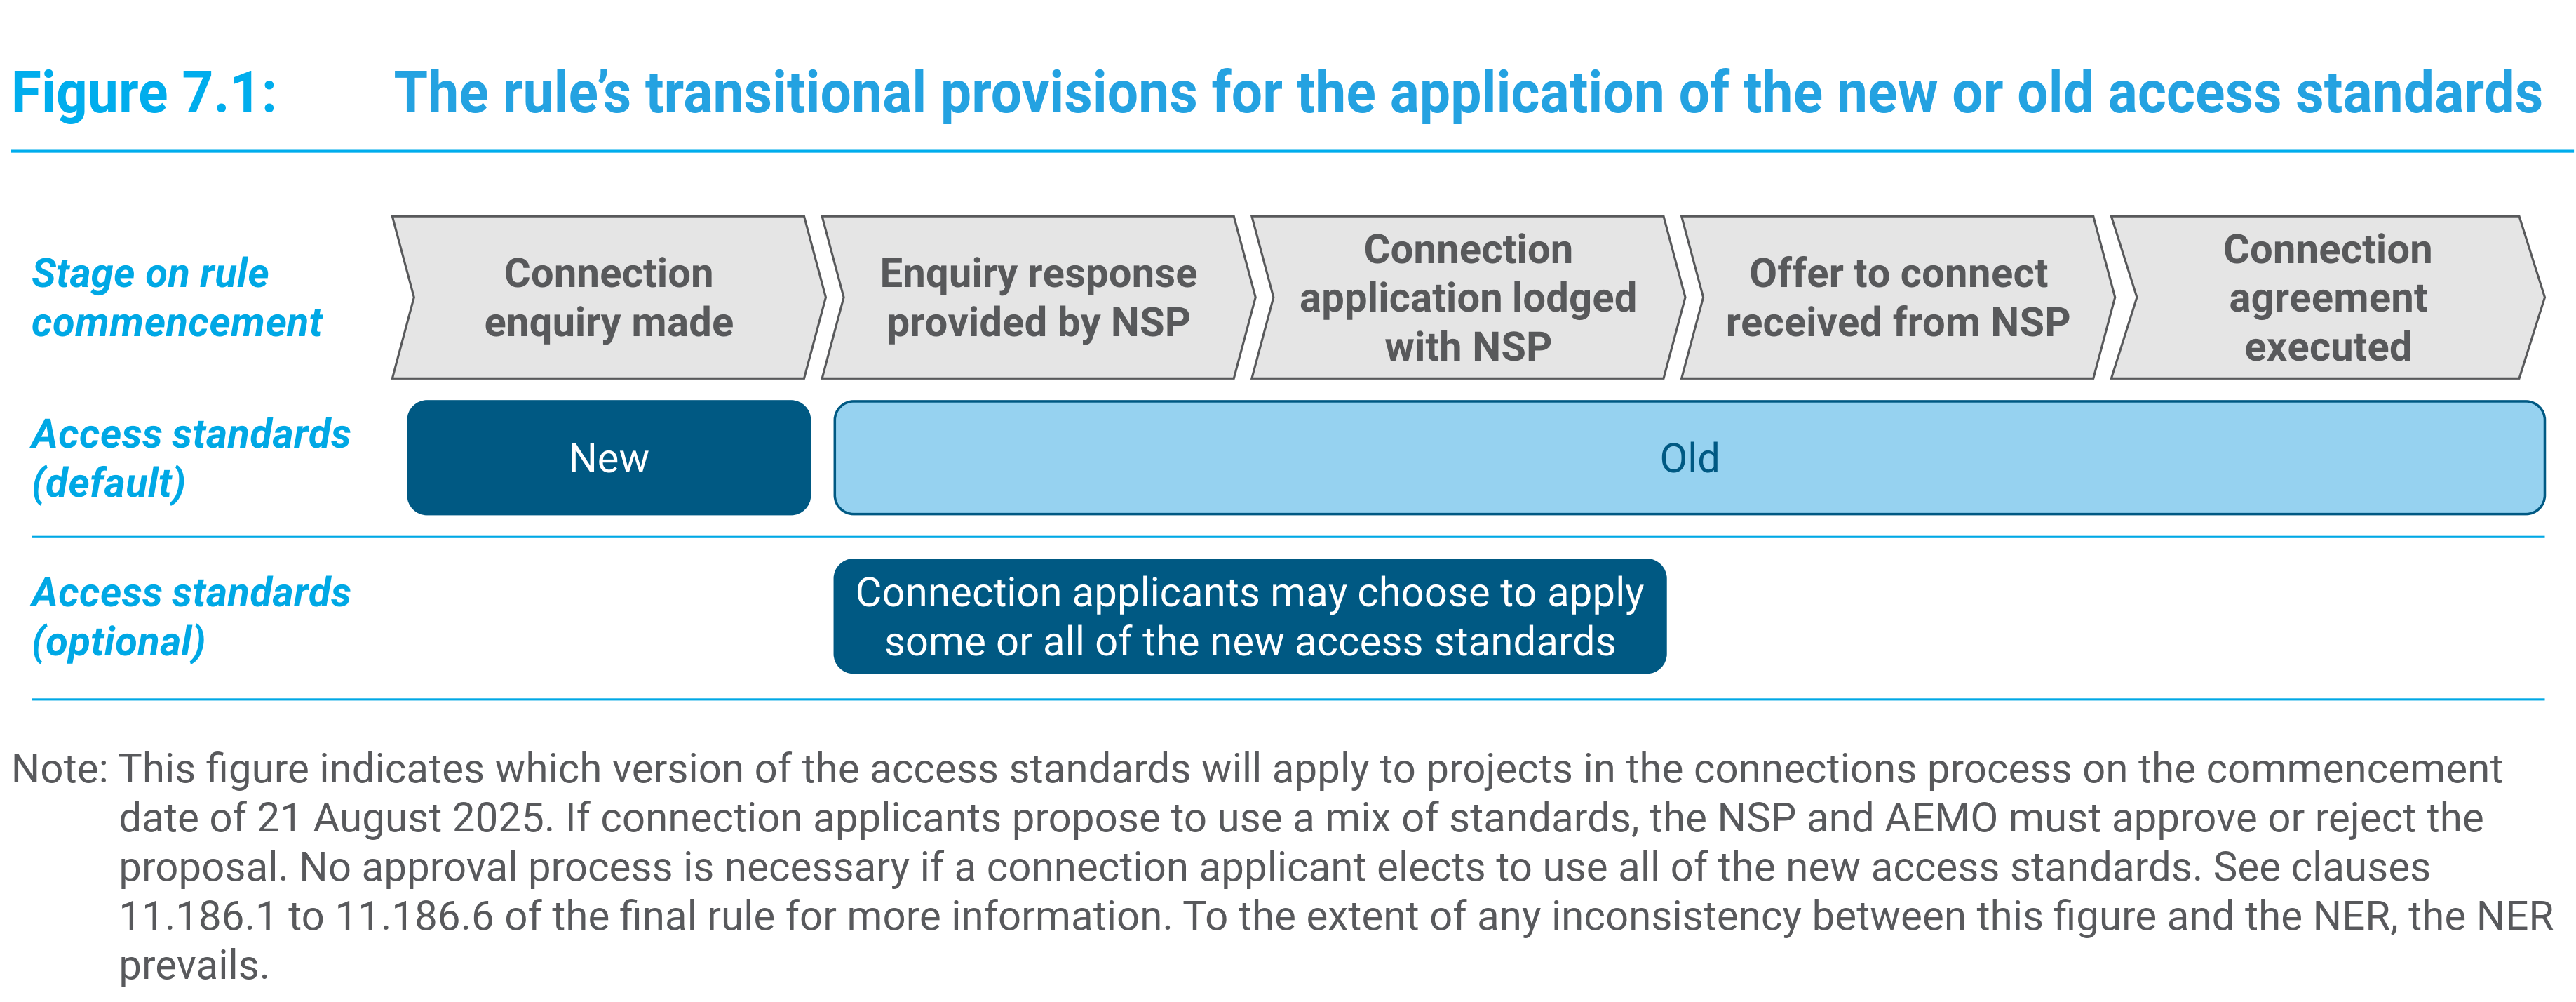
As shown in the image below, these new grid connection requirements become mandatory for all projects which haven't received a connection enquiry response by 21 August 2025. Projects which have received a connection enquiry response but have not yet received an offer to connect "may choose to apply some or all of the new access standards for their connection".
Configuration
S5.2.4 Provision of information
The purpose of S5.2.4 is to outline the information which your project must provide to AEMO or the NSP. In particular, this includes the provision of PSS®E and PSCAD™ models of your generating system which meet the requirements of the AEMO | Power System Model Guidelines | Version 2 | July 2023. We've included tests which assess some of these requirements.
S5.2.5.1 Reactive power capability
The purpose of S5.2.5.1 is to identify your generating system's reactive power capability while operating across a range of different conditions (e.g. active power outputs, connection point voltages and ambient temperatures).
Constrained vs unconstrained capability
This template creates a constrained reactive power capability curve. This means that all limiters are included and modelled (e.g. PPC limits, generating unit limits and excitation system limiters). It is a representation of the actual reactive power capability of the generating system as configured.
In contrast, an unconstrained capability curve is the raw generator capability without any external limitations. Creating an unconstrained reactive power capability curve using PSS®E and PSCAD™ is possible however, due to model aggregation, it can often not align very well with the actual capability.
If you need to create an unconstrained capability curve, we recommend you use the DIgSILENT PowerFactory disaggregated model which is used for the S5.2.5.2 harmonic studies and using the PowerFactory built-in PQ capability curve macro. PowerFactory supports voltage dependent capability curves (unlike PSS®E's GCAP function) which is important for inverter based generation. Note that this macro creates a PQ capability curve across a range of voltages, whereas the constrained capability curve created in this template creates a VQ capability curve across a range of active powers.
Creating a constrained capability curve
By default, our AEMO GPS template only tests a select number of points over the S5.2.5.1 VQ capability curve. These points are all permutations of the following:
- Vpoc: 0.9 [p.u.], Mid-point voltage - 0.05 [p.u.], Mid-point voltage, Mid-point voltage + 0.05 [p.u.] and 1.1 [p.u.]
- Ppoc: P0 and Pmax
- Qpoc: Qmin, Q0 and Qmax
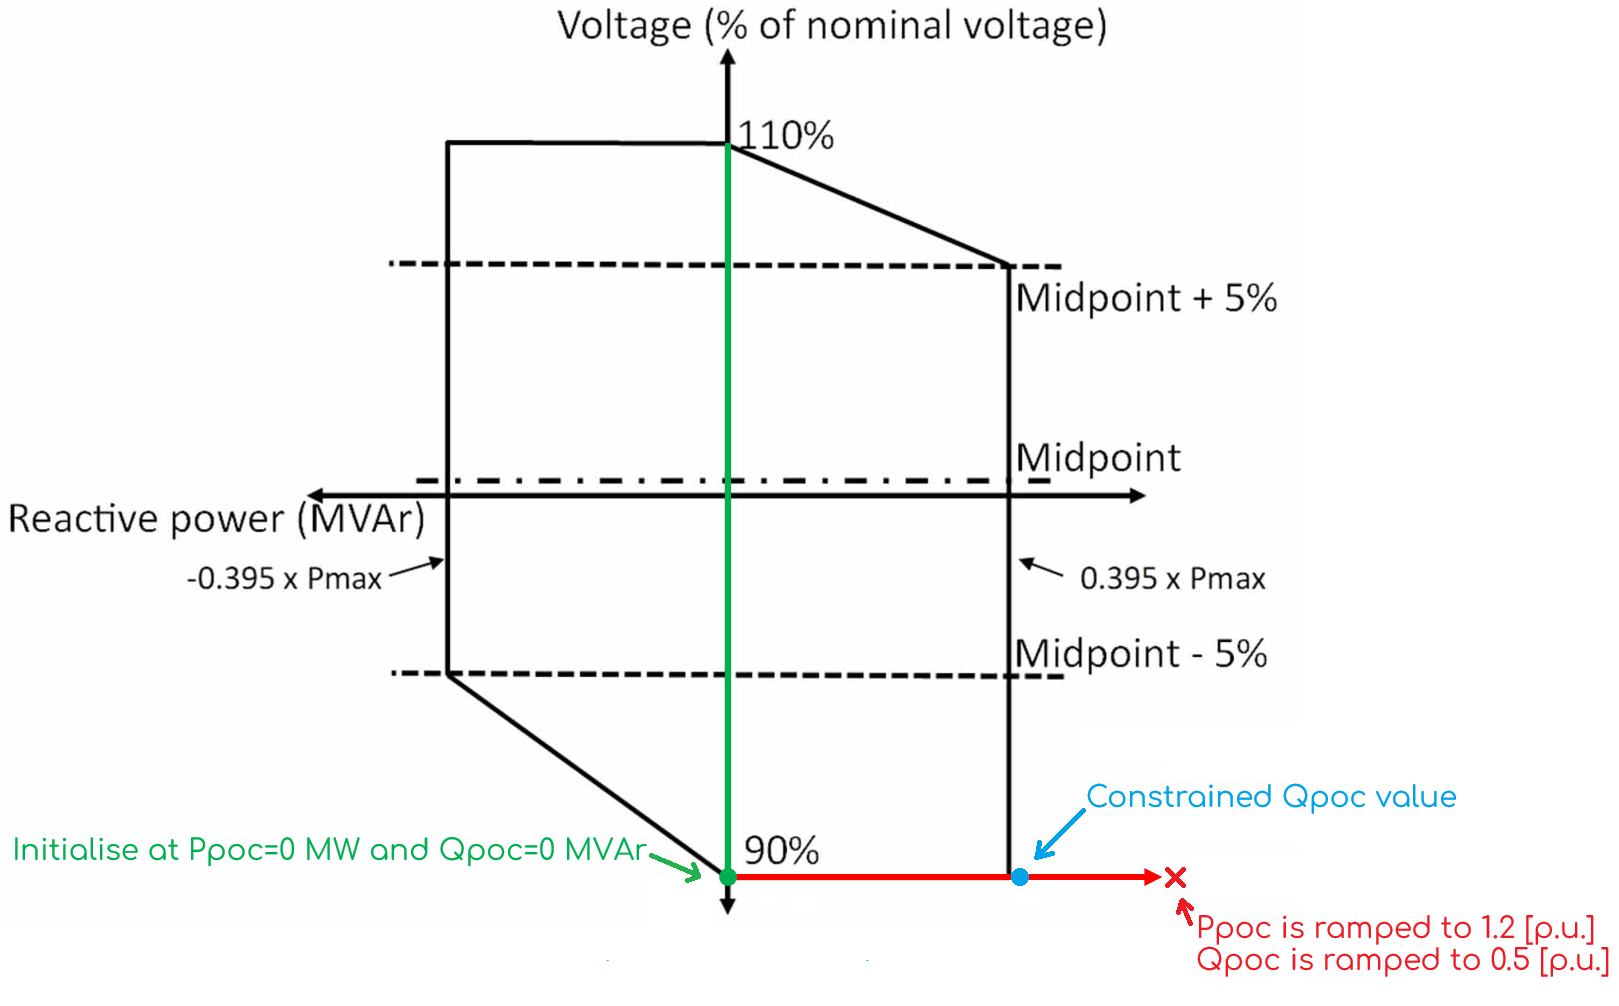
The generating system is initialised at the target value of Vpoc, Ppoc=0MW and Qpoc=0MVAr and then instructed to ramp to the following Ppoc and Qpoc points:
- Ppoc is ramped to either 0 or 1.2 [p.u.] of Pmax (i.e. a value outside of the capability curve).
- Qpoc is ramped to 0, -0.5 or +0.5 [p.u.] (i.e. values outside of the typical 0.395 [p.u.] capability).
The values of Ppoc=1.2 [p.u.] and Qpoc=±0.5 [p.u.] are arbitrary values which are known to be beyond the generating system capability and will therefore cause the limiters (e.g. PPC limits, generating unit limits and excitation system limiters) to prevent the generating system from reaching the specified value, but the final achieved value should settle within the S5.2.5.1 AAS requirements. The image below shows an example of this methodology, where the plant is initialised at Vpoc=0.9 [p.u.], Ppoc=0 [p.u.], Qpoc=0 [p.u.] - then ramped to Ppoc=1.2 [p.u.], Qpoc=+0.5 [p.u.] and the resultant constrained Qpoc value is observed.
As outlined in S5.2.5.1(a1), the generating system must meet the polygon requirements in the VQ capability curve, "at any level of active power". However, it is difficult to visualise on the VQ capability curve that the requirements are met at different active powers. You should therefore confirm via the time-series plots or the additionally provided PQ scatter plot that the generating system did meet the expected active power levels for the range of values provided on the VQ capability curve. In the additionally provided PQ scatter plot, we have included arbitrary 1% regulation bands around the expected Pmax and P0 values.
If your generating system is a BESS, you can convert the VQ capability curve into a 4 quadrant capability by enabling all loops in Loop: Start Node 1761.
- Tests are conducted at infinite SCR and X/R.
- Tests are conducted using a playback generator with infinite inertia.
Plants electrically connected but not in service
In accordance with S5.2.5.1(a2) and S5.2.5.1(b2), plants which are electrically connected to the grid but not in service (i.e. not exporting active power), have requirements regarding how they can affect the connection point voltage. This may be relevant in the following situations:
- Solar farms which are operating in 'Q at night mode'.
- Wind farms which have reactive power compensation devices such as STATCOMs.
- Synchronous machines operating in 'synchronous condenser mode'.
To check compliance with these requirements, we have not included tests under the S5.2.5.1 section. Instead, we recommend creating a relevant scenario in your project using Scenario Variables and running the relevant tests from S5.2.5.13.
S5.2.5.2 Quality of electricity generated
The purpose of S5.2.5.2 is to confirm that your generating system's output does not exceed specified voltage fluctuation, harmonic voltage distortion and voltage unbalance limits.
We don't currently provide tests for S5.2.5.2.
S5.2.5.3 Response to frequency disturbances
The purpose of S5.2.5.3 is to confirm the ability of your generating system to maintain continuous uninterrupted operation for a particular frequency operating standard. We've also included tests to confirm that some form of frequency protection exists and its behaviour is as expected.
- Tests are conducted at infinite SCR and X/R.
- Tests are conducted using a playback generator with infinite inertia.
- All frequency 'steps' are completed at a 4Hz/s ramp rate.
Frequency operating standards
S5.2.5.3 makes references to terms such as, "normal operating frequency band", "operational frequency tolerance band", and "extreme frequency excursion tolerance limits" whose values are provided in the AEMC | Frequency Operating Standard | Effective 9 October 2023. To determine that your generating system meets its requirement, you must choose a frequency ride-through SMIB playback test depending on your relevant frequency operating standard. Several common operating standards have been provided below. Copy and paste the chosen frequency operating standard into the PSS®E Dynamic and PSCAD™ Node SMIB frequency playback fields in all Nodes connected to Start Node 1028.
The "System restoration - Mainland" option is chosen by default in the template since because it represents the most difficult frequency ride through disturbances for the majority of projects (i.e. on the mainland).
Under frequency
- Normal - Mainland
- Island - Tasmania
- System restoration - Mainland [Default]
- CWO REZ
0,          50
5,          50
5.75,       47
120,        47
120.5,      49
600,        49
600.2125,   49.85
0,          50
5,          50
5.75,       47
120,        47
120.25,     48
600,        48
600.25,     49
0,          50
5,          50
5.75,       47
120,        47
120.5,      49
600,        49
600.125,    49.5
0,          50
5,          50
5.75,       47
120,        47
120.25,     48
600,        48
600.375,   49.5
Over frequency
- Normal - Mainland
- Island - Tasmania
- System restoration - Mainland [Default]
- CWO REZ
0,          50
5,          50
5.5,        52
120,        52
120.25,     51
600,        51
600.2125,   50.15
0,          50
5,          50
6.25,       55
120,        55
120.75,     52
600,        52
600.25,     51
0,          50
5,          50
5.5,        52
120,        52
120.25,     51
600,        51
600.125,    50.5
0,          50
5,          50
5.5,        52
600,        52
600.375,    50.5
S5.2.5.4 Response to voltage disturbances
The purpose of S5.2.5.4 is to confirm the ability of your generating system to maintain continuous uninterrupted operation (CUO) for particular voltages at the connection point. We've also included tests to confirm that some form of voltage protection exists and its behaviour is as expected.
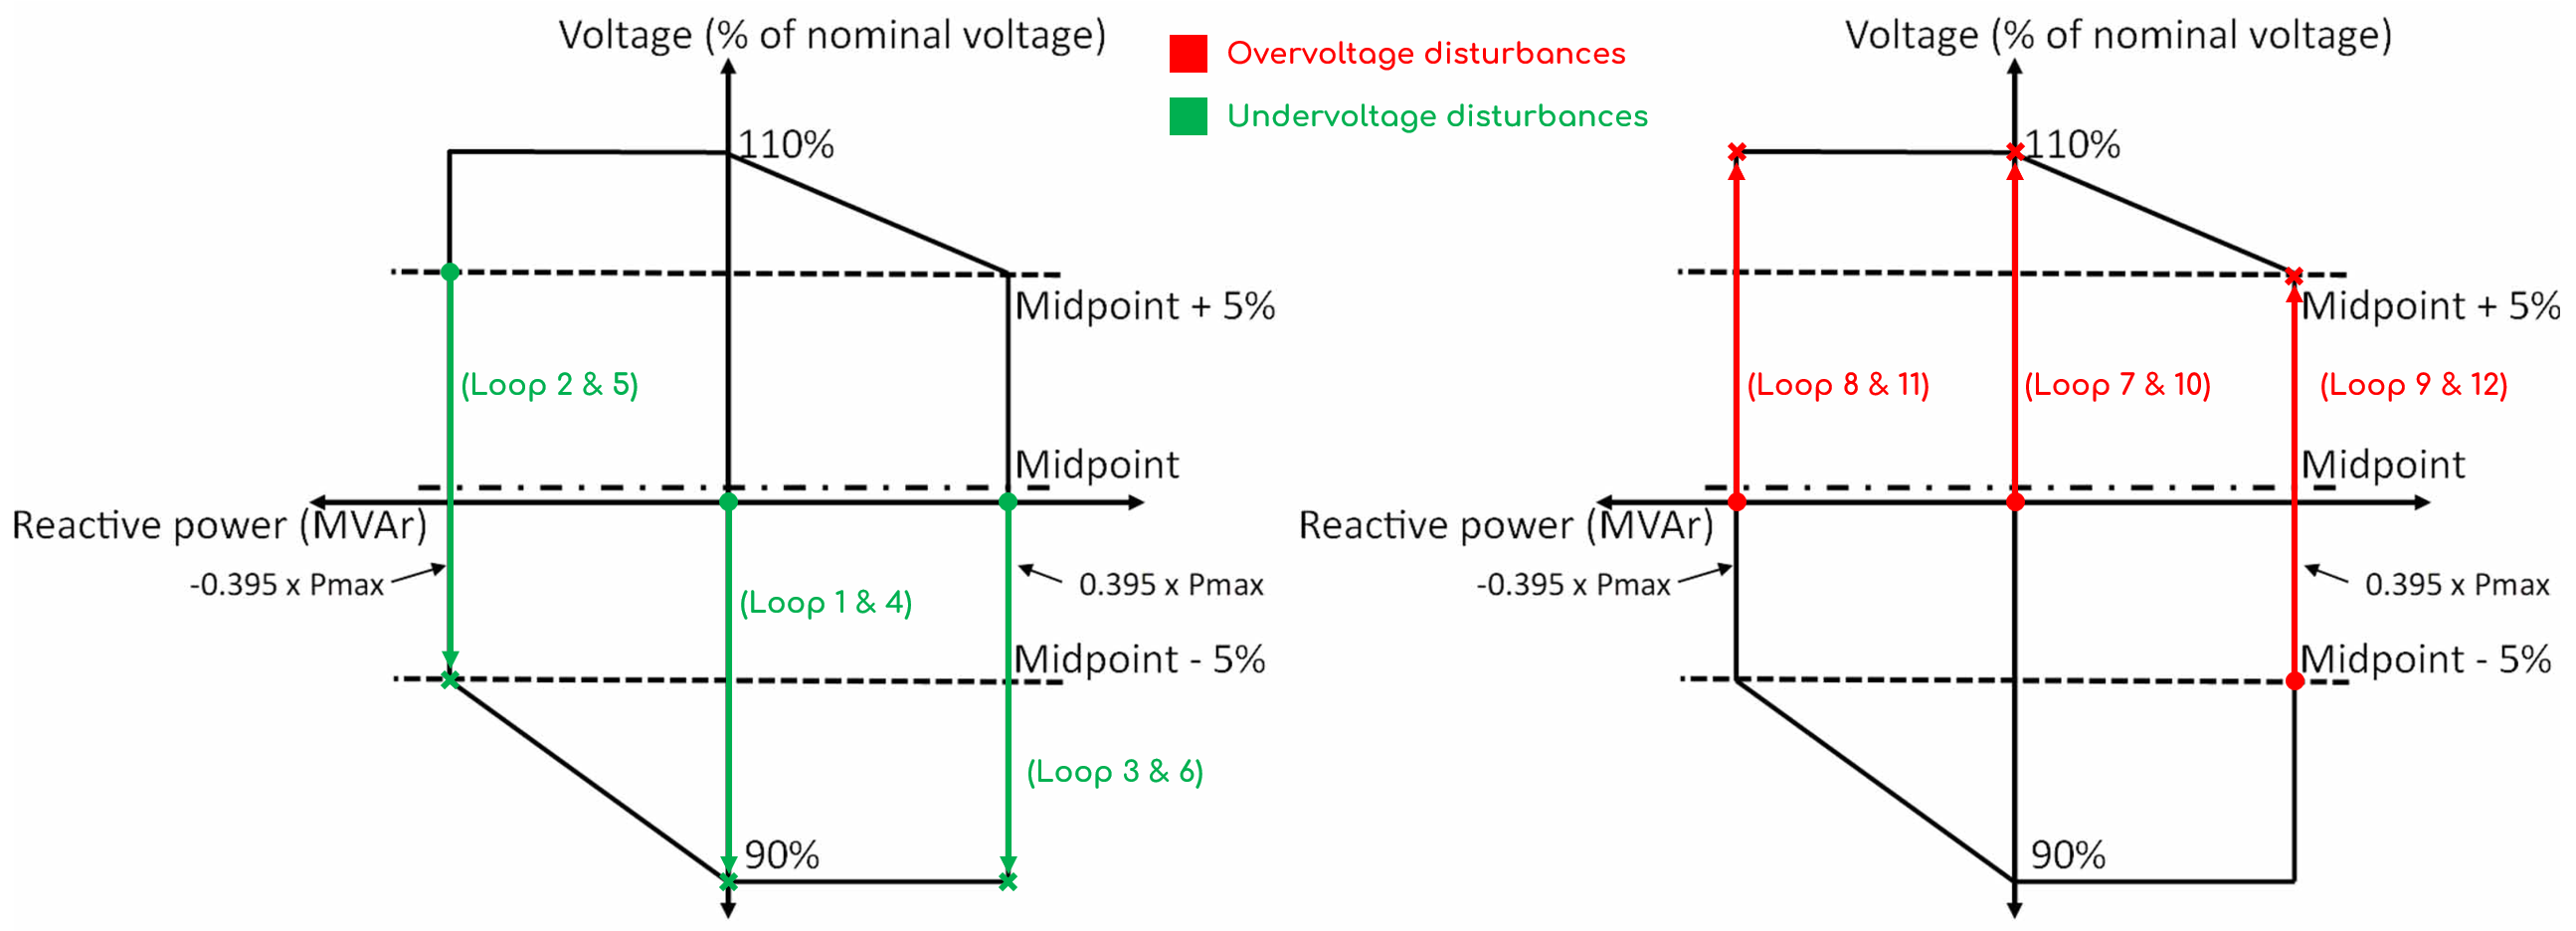
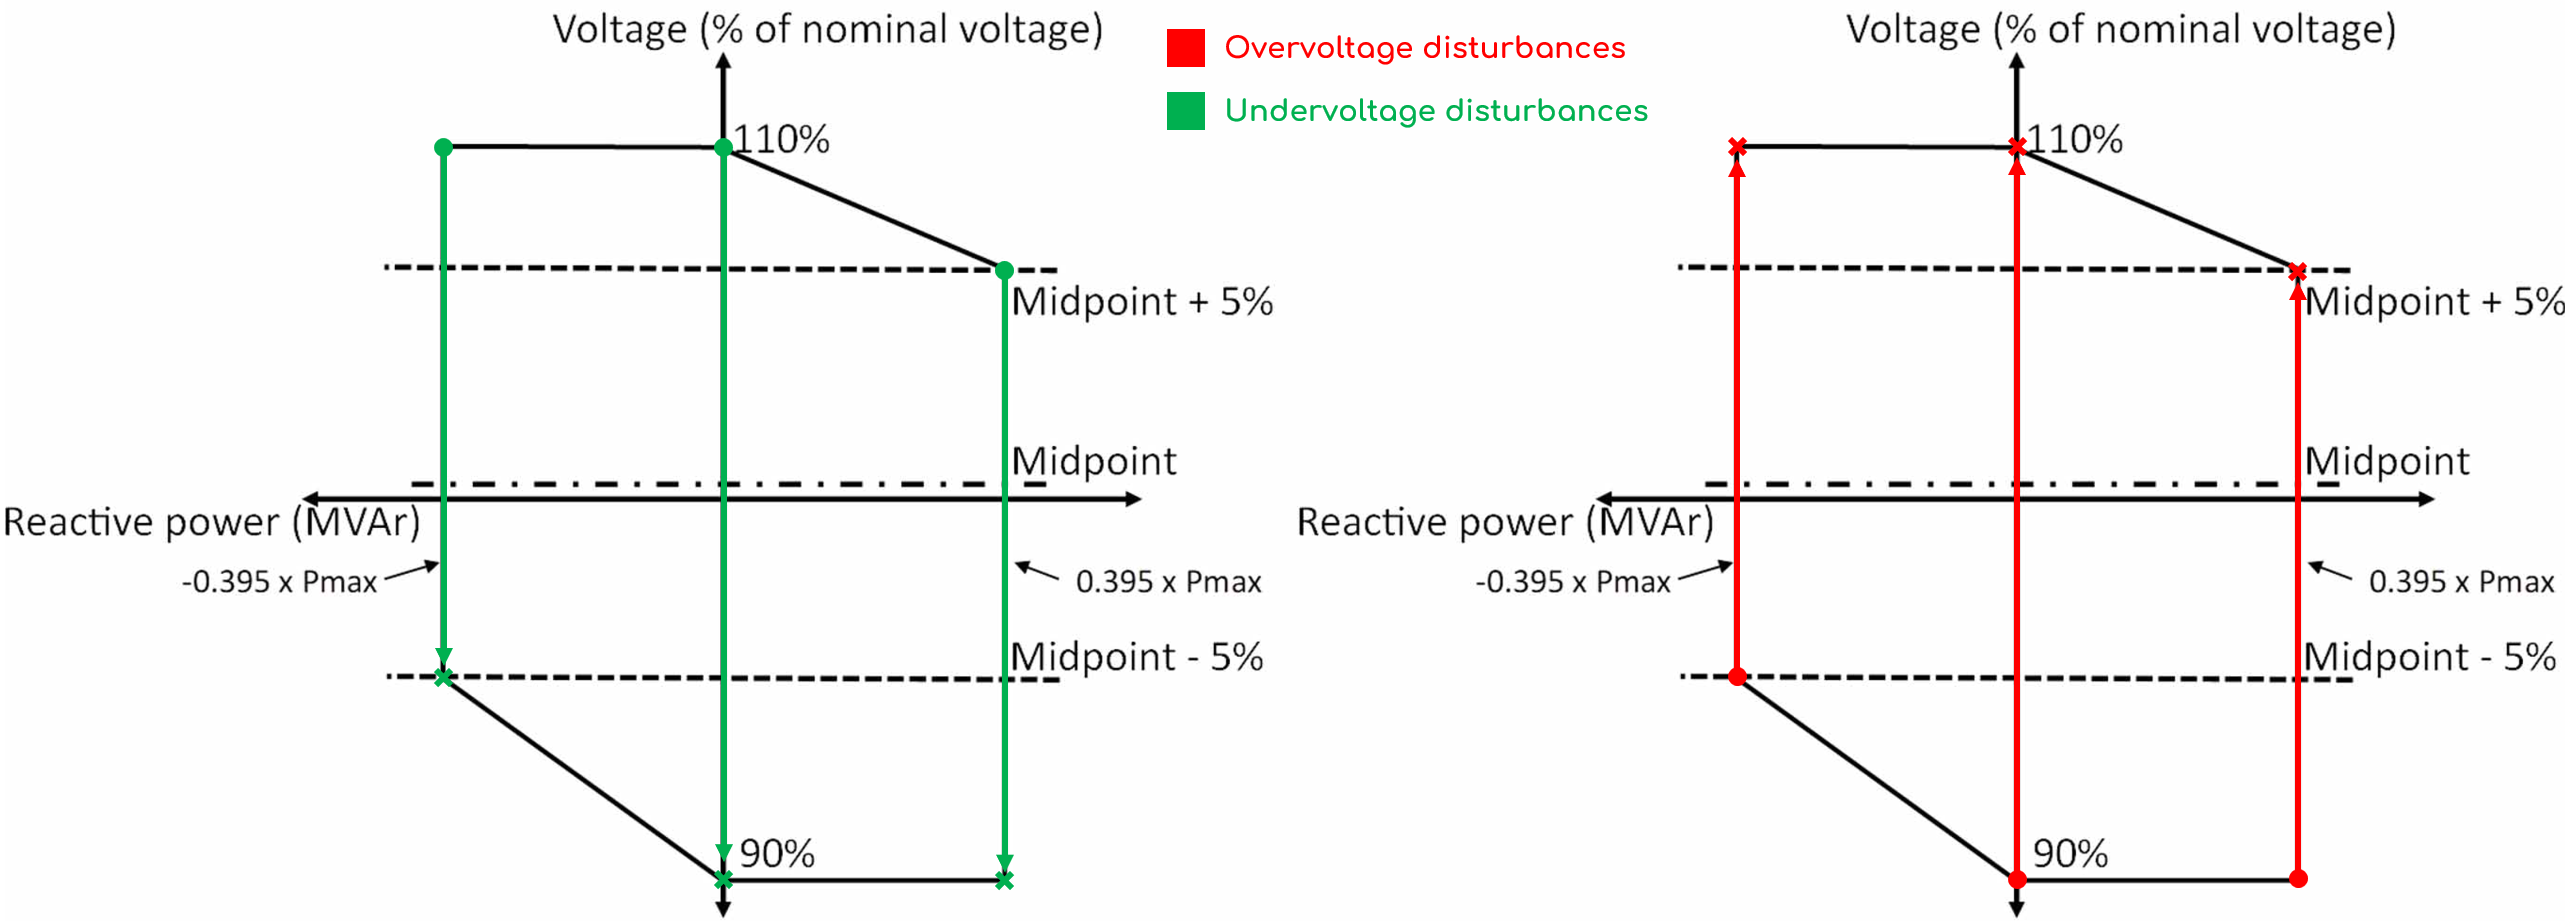
The image below shows the methodology used to demonstrate compliance with S5.2.5.4(e1). For undervoltages, a 10% undervoltage disturbance is applied such that the final value is on the lower bounds of the S5.2.5.1 AAS polygon. For overvoltages, a 10% overvoltage disturbance is applied such that the final value is on the upper bounds of the S5.2.5.1 AAS polygon. These tests are completed for the following permutations:
- Ppoc: Pmin and Pmax
- Qpoc: Qmin, Q0 and Qmax
S5.2.5.4(e2)(1) states that generating systems may use "onload tap-changing transformers, plant switching and overload capability" to meet the requirements of S5.2.5.4(e1). The simulation duration for these tests is set to 30 seconds by default. If your PSS®E and PSCAD™ models contain dynamic tap-changer components (e.g. a OLTC1T in the PSS®E model) and you depend on a tap-changing operation to maintain CUO, you will need to increase the simulation duration to allow for tap-changing operation.
- Tests are conducted at infinite SCR and X/R.
- Tests are conducted using a playback generator with infinite inertia.
- Ride-through tests for each voltage range are chosen such that the time spent within that range includes any time spent in the more onerous ranges.
- "at least marginally exceeding 130%" is represented by 132%.
- We haven't included tests to demonstrate compliance with 5.2.5.4(c1). This clause allows a generating system with point of connection voltages below 66 kV and without a main onload tap-changing transformer to use a negotiated access provision for applying under/over voltage events at the electrically closest bus that is ≥66 kV, instead of at the connection point. We haven't added tests for this negotiated access provision. If you need to complete such a test, you may need to perform additional network PSS®E dynamic studies which aren't currently included in this template.
- We haven't included tests to demonstrate compliance with 5.2.5.4(e3), given the subjective nature of the term "reasonable temporary alterations". For clarity, if those tests were completed, they would follow the methodology shown in the image below.
S5.2.5.5 Disturbance ride-through capability
The purpose of S5.2.5.5 is to confirm your generating system's ability to ride through voltage disturbances. Since S5.2.5.5(c) references continuous uninterrupted operation requirements and clause (b) of the Chapter 10 definition of this term references the broader performance standards requirements, the purpose of the clause is also to confirm your generating system's active and reactive power response during and after disturbances.
There are three runs which make up this performance standard:
- [SMIB] Balanced MFRT: Balanced multiple-fault ride-through performance (MFRT).
- [SMIB] Unbalanced MFRT: Unbalanced multiple-fault ride-through performance (MFRT).
- [Network] Network fault performance: Response to balanced and unbalanced faults, including MFRT as required in a network model (also assesses active power recovery time, reactive current commencement and rise time).
Selecting alternative multiple-fault ride-through curves
S5.2.5.5(d) of the NER defines the criteria for a multiple-fault ride-through. There are a total of 20 curves available for selection, 10 for unbalanced fault sequences (S1 through S10) and 10 for balanced fault sequences (P1 through P10). For details, see the MULTIFAULT Command. You can test additional fault sequences by adding new loop rows into Loop: Start Nodes 1670 and 1679.
Set up network cases and faults
The Start Node 1862 [NETWORK] S5.2.5.5: Network fault performance is used to complete dynamic power system studies on a wide-area PSS®E model, known as NEM snapshots (or colloquially also known as 'OPDMS snapshots'). Tests for "[Network] Fault performance" help demonstrate compliance to S5.2.5.5(c) and S5.2.5.5(k).
Currently, this template assumes that all generators which are to be considered as part of the studies are already merged into the network model. The network model is also load flow stable and dynamically stable. Your generating system does not need to be present in the NEM snapshot as it will be auto-merged by gridmo. See our example for more information on merging multiple generators into a network model.
Configure network studies using these global variables. Add Network - Case 3 and further cases when you study additional NEM snapshots.
| Category in gridmo | Global variables |
|---|---|
| Network - General | psse_ss_network_generating_system_configurationpsse_ss_network_advanced_parameterspsse_ds_network_advanced_parameters |
| Network - Case 1 (e.g. Summer Hi) | psse_ds_network_configuration_1network_case_description_1psse_network_case_file_1psse_network_dyre_file_1psse_network_library_folder_1psse_network_poc_bus_1psse_ss_network_configuration_1psse_ss_network_outputs_1psse_ds_network_outputs_1 |
| Network - Case 2 (e.g. Spring Lo) | psse_ds_network_configuration_2network_case_description_2psse_network_case_file_2psse_network_dyre_file_2psse_network_library_folder_2psse_network_poc_bus_2psse_ss_network_configuration_2psse_ss_network_outputs_2psse_ds_network_outputs_2 |
Update the following to complete the network studies:
- In the
PSS®E DynamicNodes for this test:- If any of your disturbances have auto-reclose enabled with an auto-reclose time less than 2000 ms, update the
END_T=7parameter inside the single subplot inside Plot Nodes3042and3055(e.g. if you have a 1700 ms auto-reclose time, update theEND_T=7parameter toEND_T=6.7)
- If any of your disturbances have auto-reclose enabled with an auto-reclose time less than 2000 ms, update the
If you have multiple NEM snapshots you are studying, copy the entire Loop: Start to Loop: End section and update as required based on your additional NEM snapshot(s).
S5.2.5.5A Responses to disturbances following contingency events
The purpose of S5.2.5.5A is to identify the response of your generating system during and after disturbances following contingency events. There are several parts of this performance standard:
- [SMIB] FRT transition bands: Identify the voltage at the connection point where the generating system enters and exits a fault ride-through mode.
- [SMIB] Fault during frequency disturbance: Apply voltage disturbances at project-specific SCR during frequency disturbance and assess response performance in accordance with S5.2.5.5A(d)(3)(ii) and S5.2.5.5A(f)(3)(ii).
- [SMIB] Balanced voltage disturbances - Response performance calculations: Apply voltage disturbances at project-specific SCR and assess response performance (Iq commencement time, Iq rise time, Ppoc recovery time).
- [SMIB] Balanced voltage disturbances - Iq injection curve: Apply voltage disturbances at infinite SCR to construct the Iq injection curve.
- [SMIB] Unbalanced voltage disturbances (1PHG, 2PHG and PHPH) - Response performance calculations: Apply voltage disturbances at project-specific SCR and assess response performance (Iq commencement time, Iq rise time, Ppoc recovery time).
- [SMIB] Unbalanced voltage disturbances (1PHG, 2PHG and PHPH) - Iq injection curve: Apply voltage disturbances at infinite SCR to construct the positive sequence Iq injection curve.
Response performance assessment criteria
S5.2.5.5A describes several assessment criteria, namely:
- Adequately controlled - S5.2.5.5A(b)(1)
- Iq commencement time - S5.2.5.5A(g)(2)
- Iq rise time - S5.2.5.5A(g)(2)
- Ppoc recovery time - S5.2.5.5A(f)(3)
These assessment criteria are unfortunately subjective and we have therefore detailed our interpretations of the key aspects of these assessment criteria.
Notes on the interpretation of "adequately controlled" in Chapter 5 of AEMC | National Electricity Rules | ERC0393 | 22 May 2025
S5.2.5.5A(b)(1) introduced a new term, `Adequately Controlled` which replaces the well-defined `Adequately Damped` term in the previous version of the NER. Unfortunately, this new definition is so subjective that we have not yet implemented an automated assessment of `Adequately Controlled` in this template.
Notes on the interpretation of "must commence" in Chapter 5 of AEMC | National Electricity Rules | ERC0393 | 22 May 2025
S5.2.5.5A(g)(2) states the following:
[for disturbances, a plant]...positive sequence reactive current response opposing the voltage change must commence within 10 milliseconds of the response initiating conditions being met, be adequately controlled and, for a step-like voltage profile at the connection point, have a positive sequence reactive current rise time of no greater than 40 milliseconds.
However, this definition is subjective due to the lack of definition of the term "must commence". The following note details gridmo's interpretation of this subjective definition as well as unused alternate interpretations.
- Interpretation [Default]
- Alternate interpretation 1
- Alternate interpretation 2
- Start time: When fault is applied
- End time: When fault is cleared
- Pass/fail requirement: Initiating conditions met + 10ms
This interpretation of the grid code requirements is used by default in the gridmo template.
We assume that the commencement time is the rise time from 0% to 10% of the final Iq value in the fault, using the same Chapter 10 rise time definition which includes the term "mean sustained change". We assume that the start time of the calculation is when the fault is applied. We assume that the end time of this calculation is the time at which the fault clears. The commencement time pass/fail requirement is interpreted as the time at which "the response initiating conditions [are] met" + 10 ms. The term "initiating conditions" is not a defined term in Chapter 10 and we assume that this is defined in S5.2.5.5A(g)(1) as the time after the fault is applied when the voltage first falls under 0.85 [p.u.] or rises above 1.15 [p.u.].
The commencement time pass/fail requirement is shown by the red vertical line, positioned 10 ms after the initiating condition time, which is indicated by the green vertical line. In this example, the generating system’s reactive current commencement time does not comply with the requirement as the shaded area exceeds the red line. The commencement time pass/fail requirement is not a fixed duration; it varies depending on when the initiating condition of the fault is met.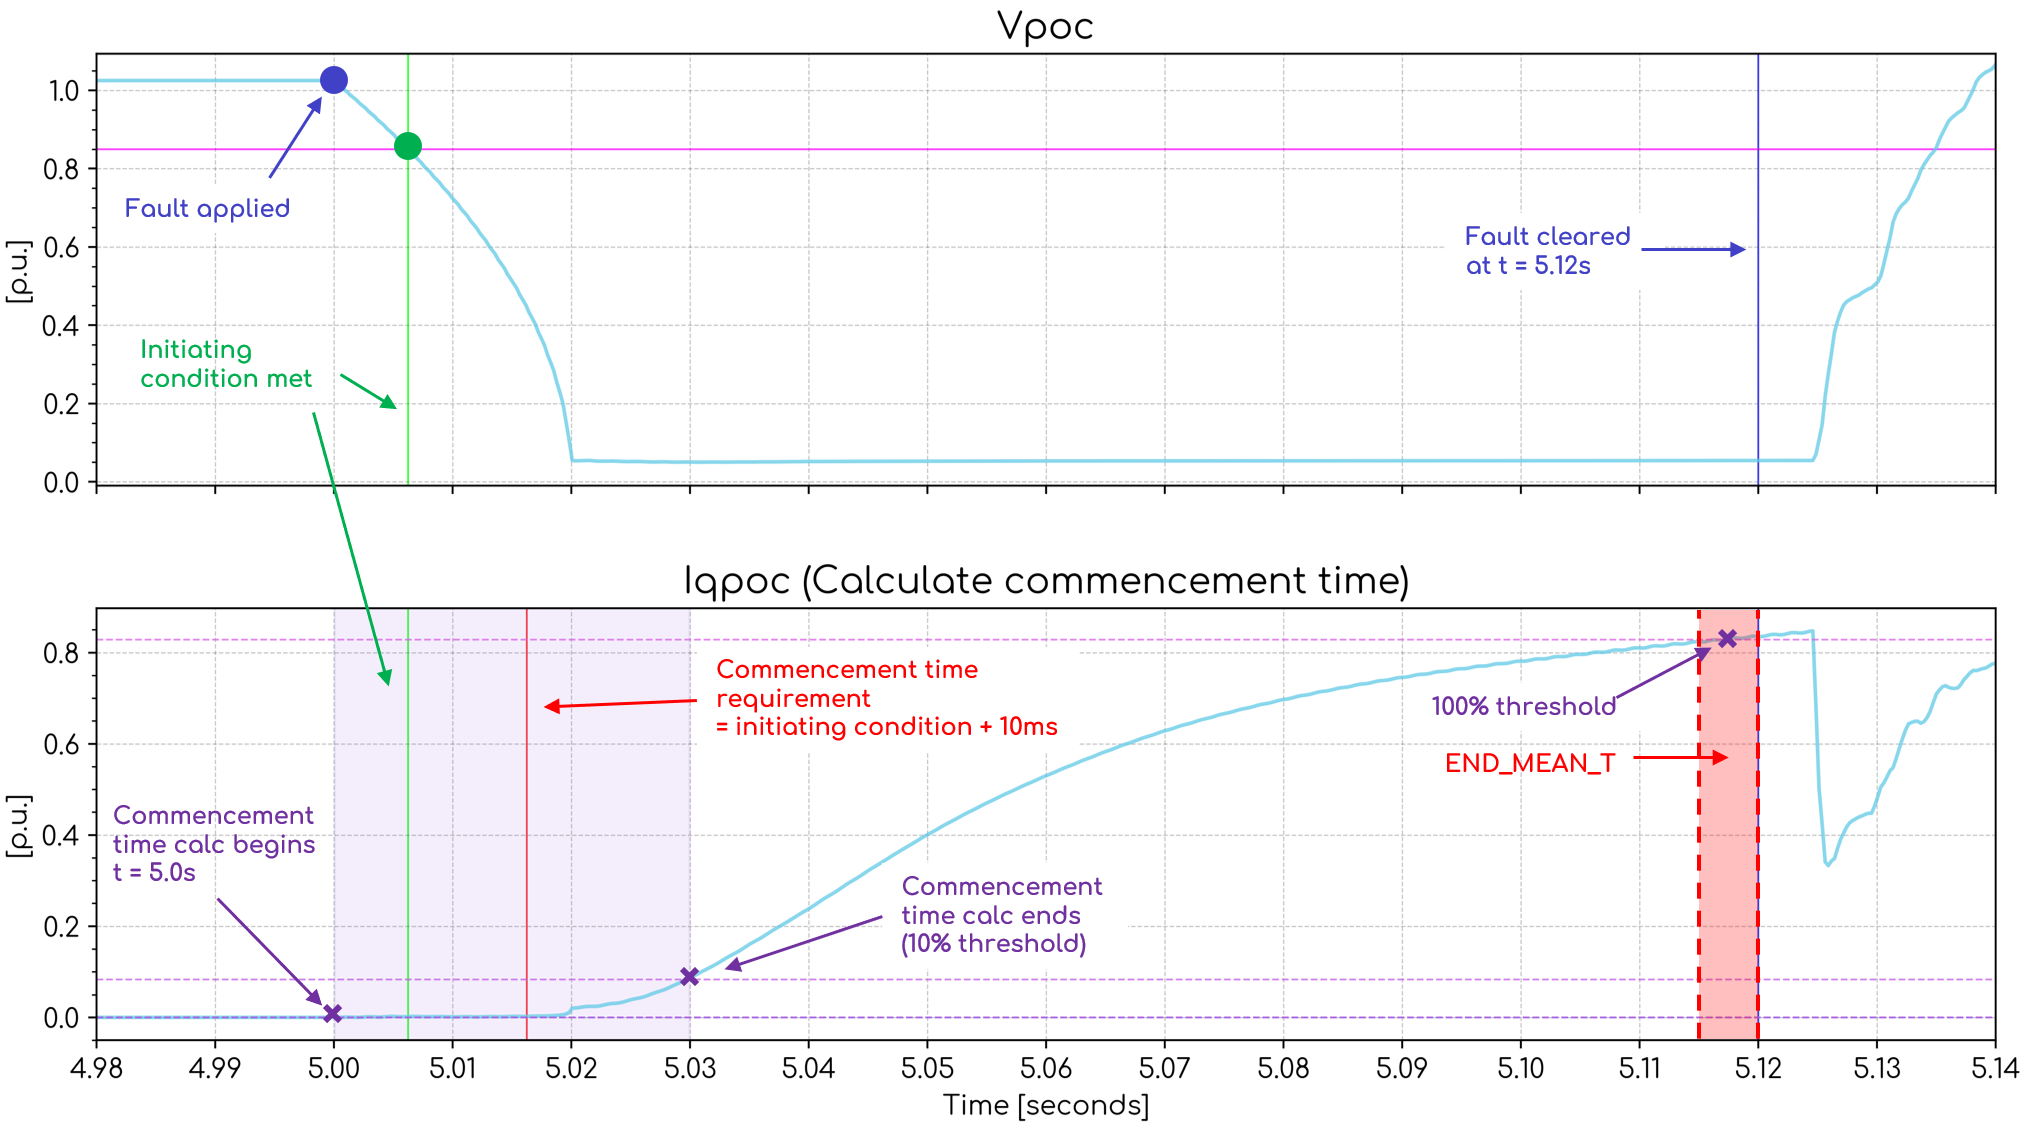
- Start time: When initiating conditions are met
- End time: When fault is cleared
- Pass/fail requirement: 10ms
We assume that the commencement time is the rise time from 0% to 10% of the final Iq value in the fault, using the same Chapter 10 rise time definition which includes the term "mean sustained change". We assume that the start time of the calculation is when the initiating condition is met. We assume that the end time of this calculation is the time at which the fault clears.
The commencement time pass/fail requirement is a fixed duration of 10ms.
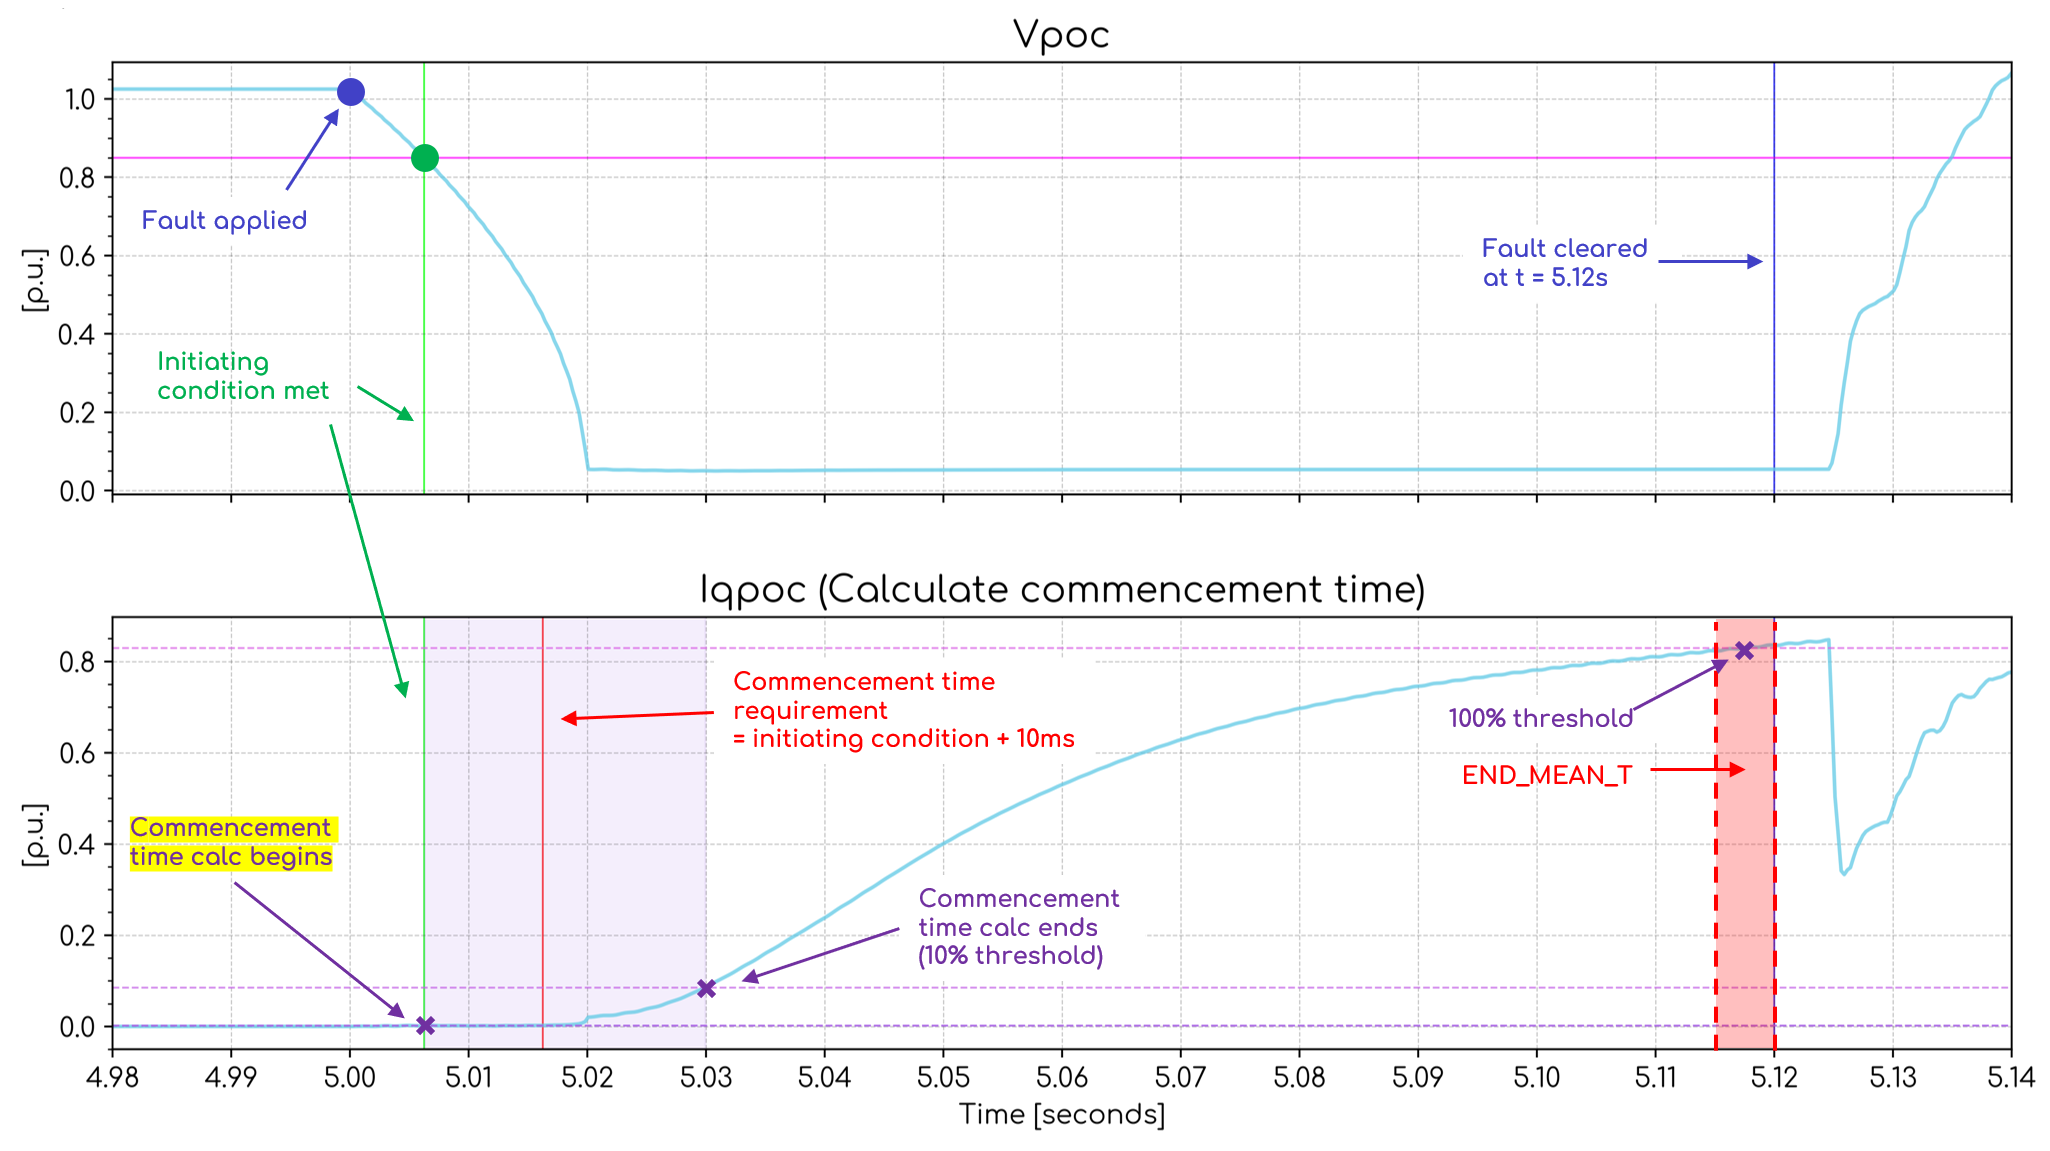
This interpretation was not chosen because, for some Iq signals with rapid responses, it is possible for the Iq response to completely rise to its final value prior to the initiating conditions being met. In this situation, the commencement time calculation is not fit for purpose. See below for an example of such a signal.
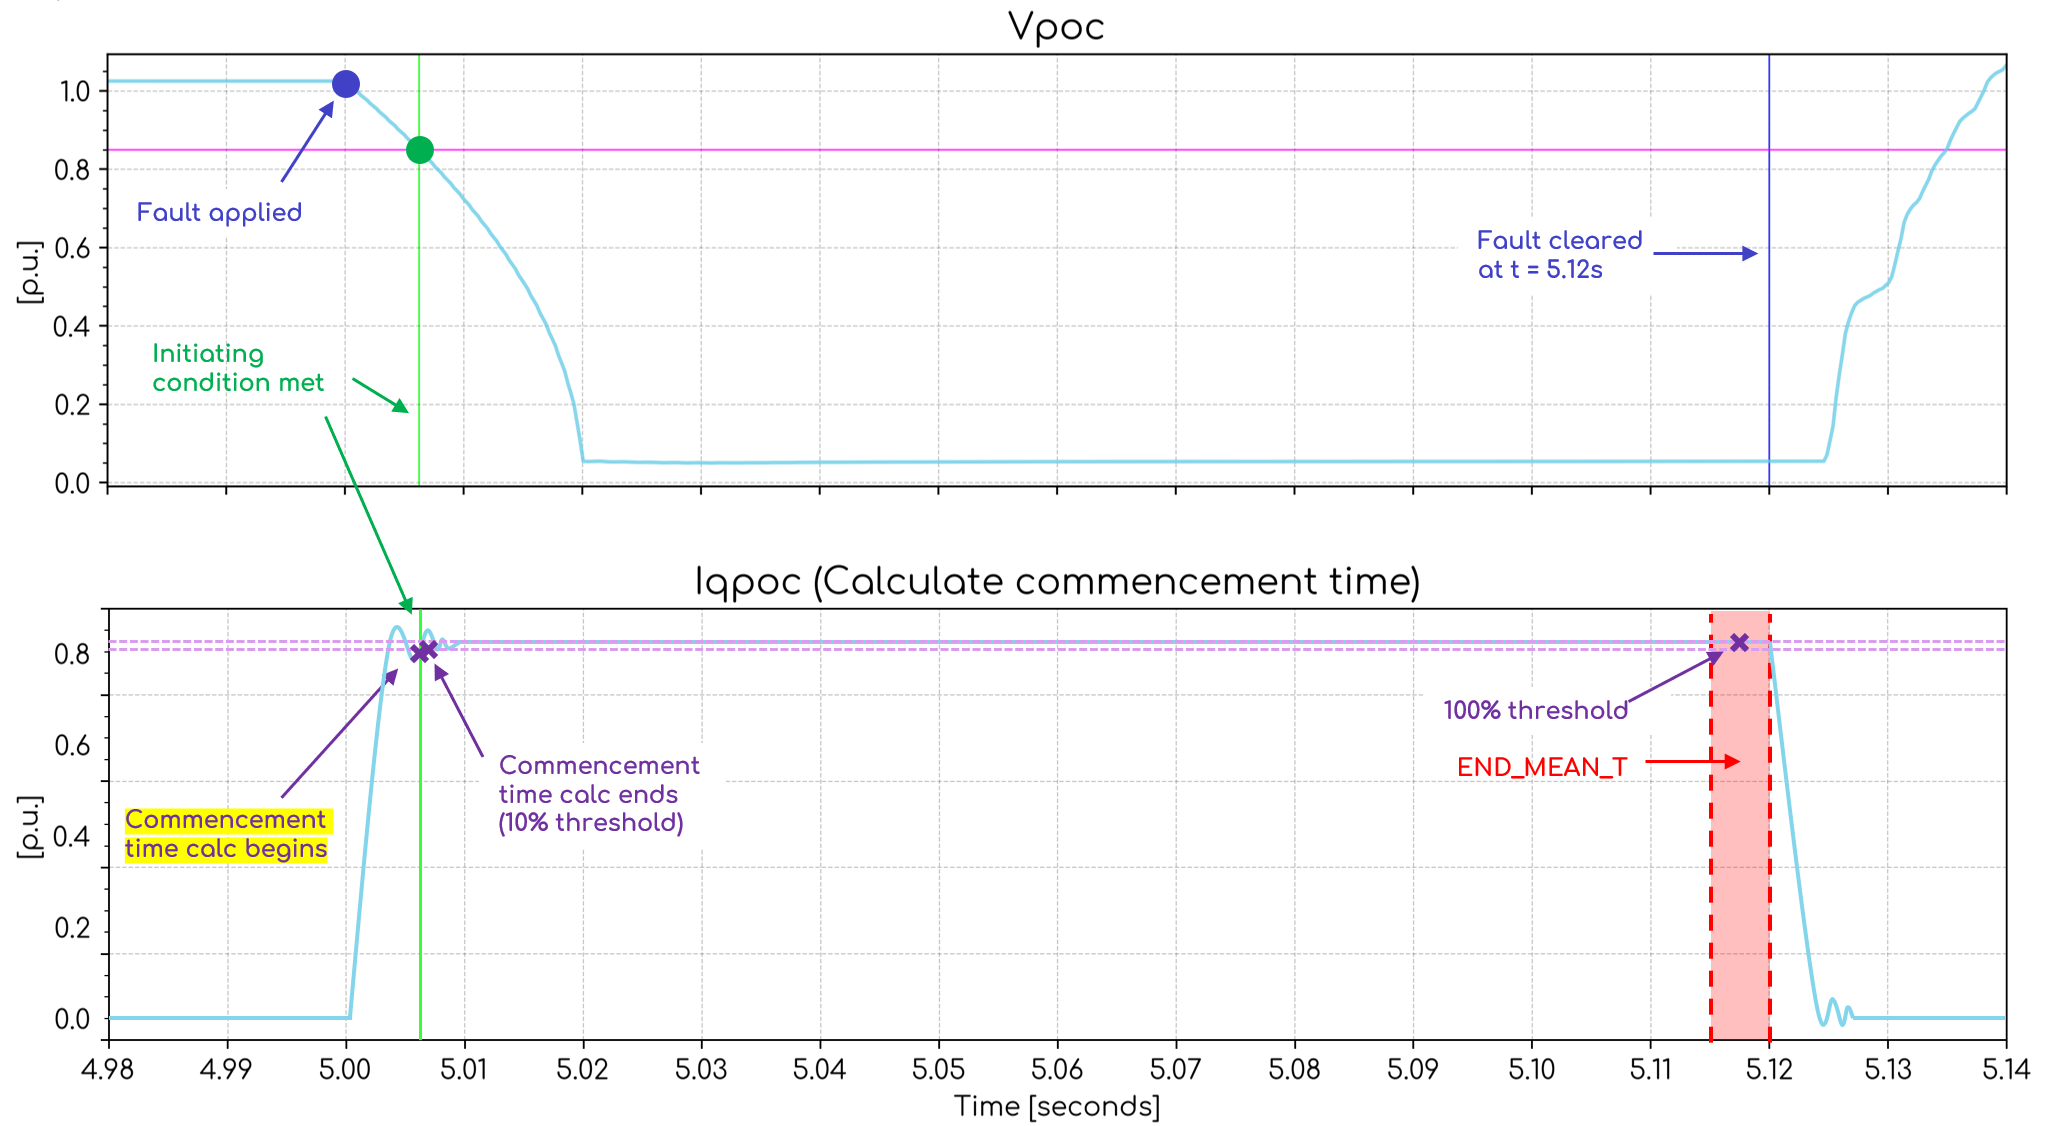
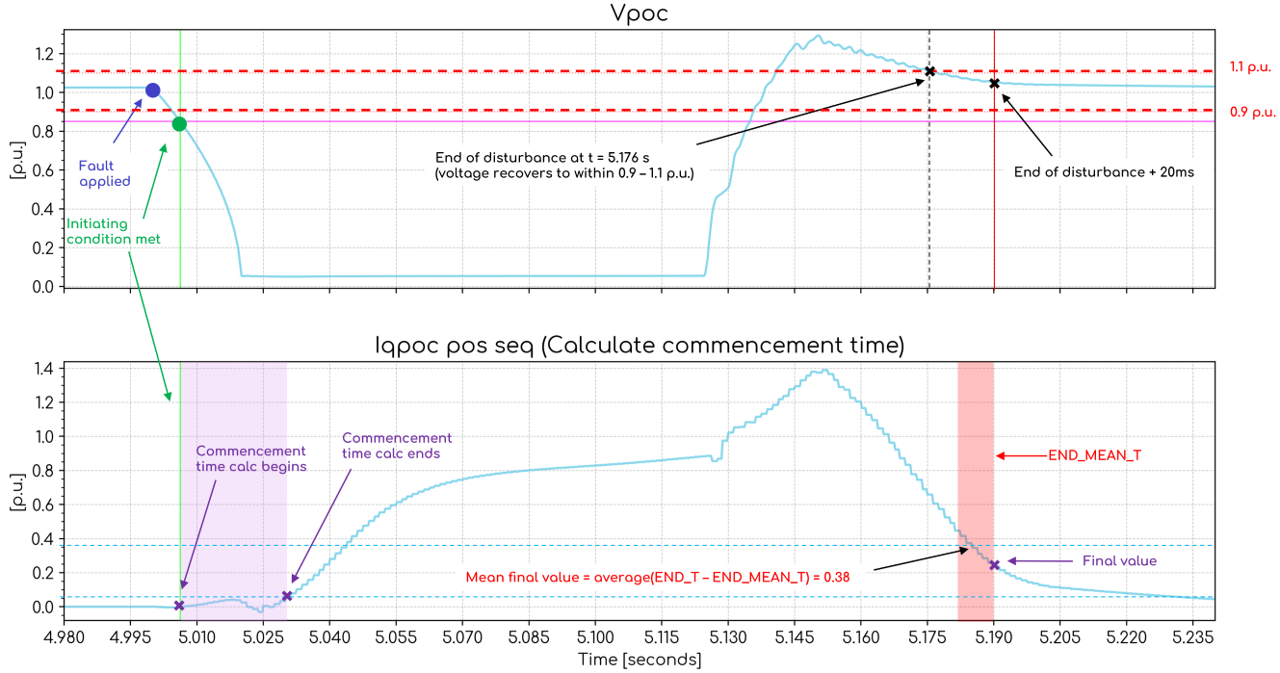
- Start time: When initiating conditions are met
- End time: When voltage has recovered within 0.9 [p.u.] to 1.1 [p.u.] + 20 ms
- Pass/fail requirement: 10ms
We assume that the commencement time is the rise time from 0% to 10% of the final Iq value in the fault, using the same Chapter 10 rise time definition which includes the term "mean sustained change". We assume that the start time of the calculation is when the initiating condition is met. We assume that the end time of this calculation is when the voltage had recovered to within 0.9 [p.u.] to 1.1 [p.u.] + 20 ms. The image below shows an example where the end of disturbance definition from S5.2.5.5(b)(3) is used, showing the the final value doesn't appear to meet the intentions of the rule. The final value does not represent the magnitude of the reactive current at the end of the fault; therefore, this interpretation is no longer used.
Notes on the interpretation of "mean sustained change" in Chapter 10 of AEMC | National Electricity Rules | ERC0393 | 22 May 2025
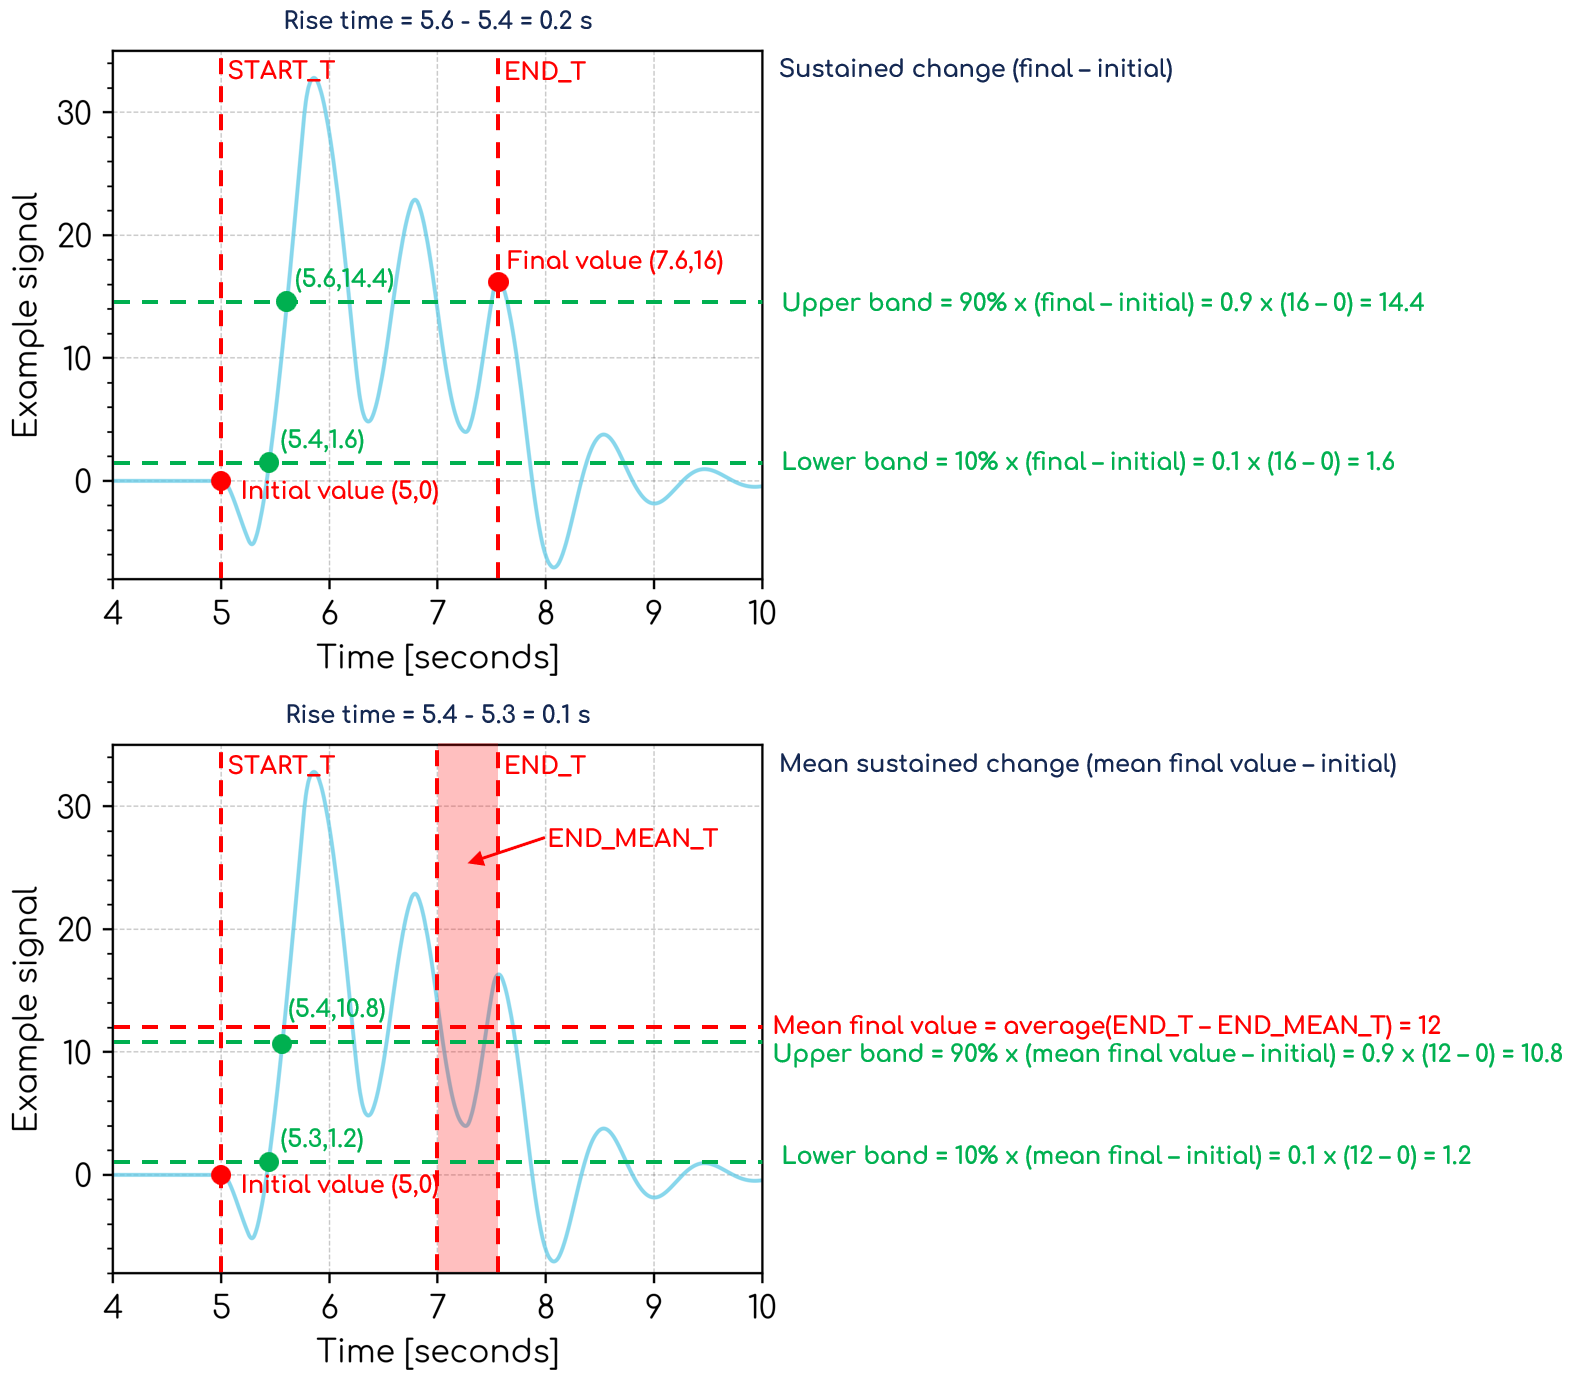
Rise time will be defined in Chapter 10 of the NER [1] as the following:
In relation to a control system, the time taken for an output quantity to rise from 10% to 90% of the mean sustained change induced in that quantity by a step change of an input quantity, disregarding longer-term dynamics and influences external to the generating system following the step change.
However, this definition is subjective due to the lack of definition of the term "mean sustained change". The following note details gridmo's interpretation of this subjective definition.
We assume that the term "mean sustained change" was used rather than "sustained change" to address the instance where a channel towards the end of the rise time calculation window may not have settled and instead have an oscillatory component. In this instance, simply taking the final value to be the value at the end of the calculation window and use this to calculate the sustained change (i.e. final value - initial value) may not have the intended result.
The images below show the results for a signal where the calculated rise time would be different based on considering the "sustained change" or the "mean sustained change". Note that even if this interpretation of the "mean sustained change" is correct and the AEMC intended participants to employ an averaging window in the calculation methodology, there is still subjectiveness of the length of such an averaging window. For this reason, we have created an argument `END_MEAN_T` in the `RISE_TIME` Plot Command so that the user can specify this averaging window length. Until further guidance is provided by AEMO, we recommend setting `END_MEAN_T` as 5%.
Notes on the interpretation of "after the end of the disturbance, reach at least 95% of...the pre-disturbance active power level controlled" in Chapter 5 of AEMC | National Electricity Rules | ERC0393 | 22 May 2025
S5.2.5.5A(f)(3)(i) states the following:
[for disturbances, a plant must]...within 100 milliseconds after the end of the disturbance, reach at least 95% of...the pre-disturbance active power level
However, this definition is subjective due to the lack of definition of the term "end of the disturbance". The following note details gridmo's interpretation of this subjective definition.
We assume that the recovery time calculation considers the new definition of the end of a disturbance as outlined in S5.2.5.5(b)(3). The start of the recovery time calculation is 20 ms after the connection point voltage has recovered to within 0.9 [p.u.] to 1.1 [p.u.].
S5.2.5.5A(t)(1) implies that assessment of unbalanced overvoltages may be required. We have assumed that performance assessments for unbalanced overvoltages is not required in this template as it is only mentioned in one location in the NER under the General requirements section.
S5.2.5.5A(f)(1)(iii) requires negative sequence Iq injection to avoid excessive voltage rise on unfaulted phases during unbalanced faults. It is unclear on what is deemed to be excessive. We have arbitrarily assumed that a voltage rise of > 0.05 [p.u.] is excessive.
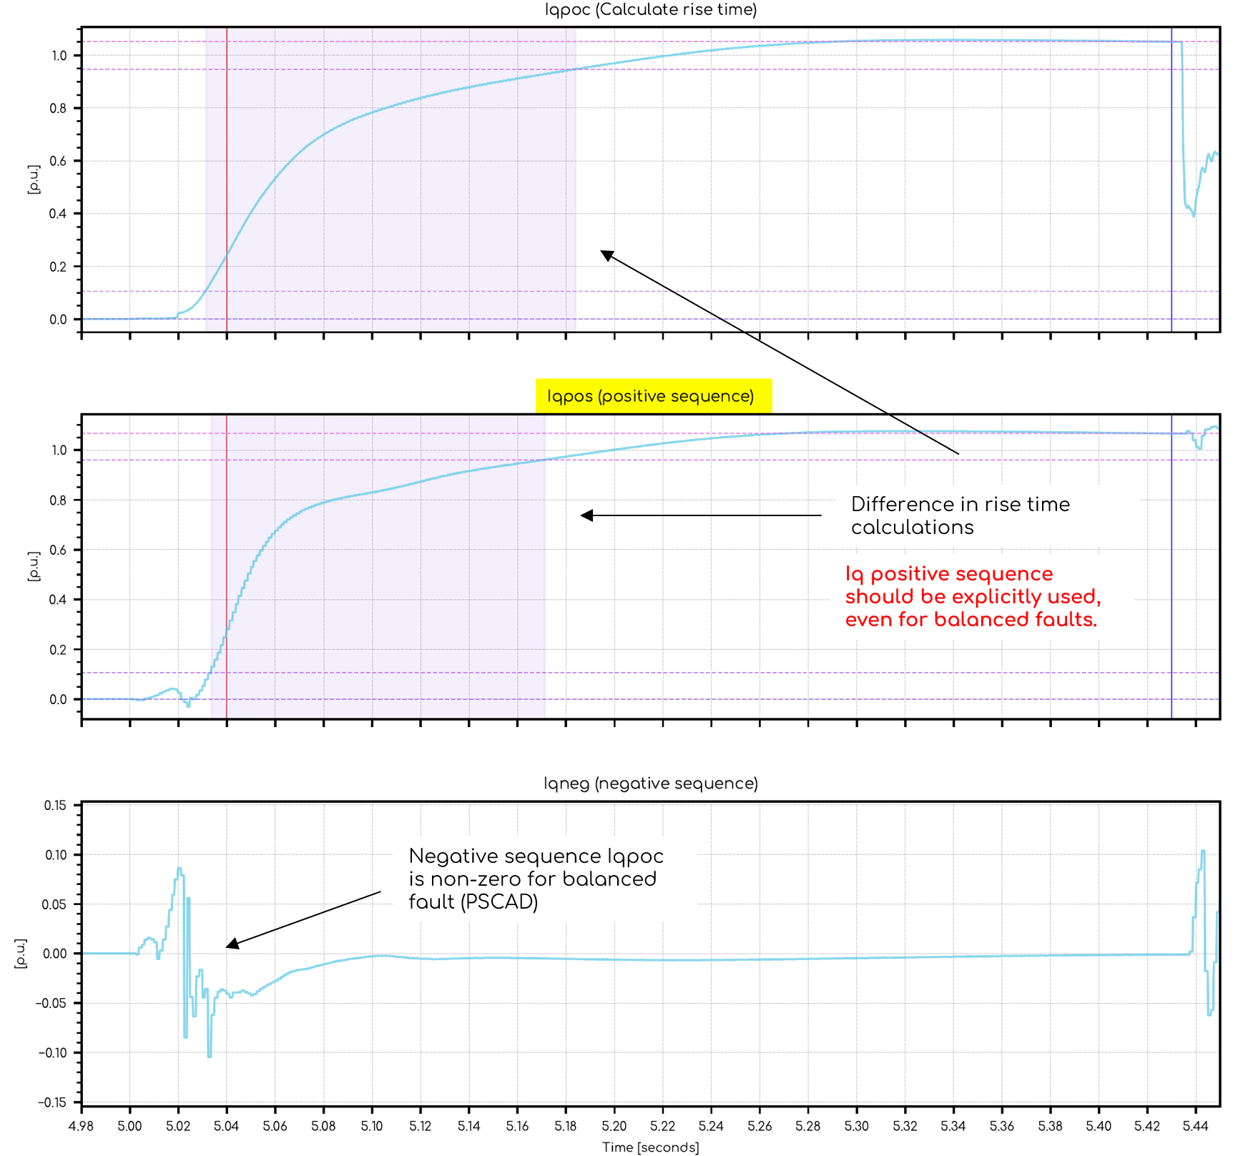
S5.2.5.5A(g)(2) states that 'the positive sequence reactive current response opposing the voltage change must...' It does not specify whether the value refers to the positive-sequence voltage or the total voltage. This template assumes total voltage, as the reactive current is explicitly defined as ‘positive sequence’ while the voltage is not
Even for balanced faults, there is a difference between Ipoc and Ipoc positive sequence when applied in PSCAD. This occurs because, for a brief period immediately after the fault is applied, the phase currents are not perfectly equal, which results in a small negative sequence component in Iq. As a consequence, Ipoc and Ipoc positive sequence may differ, and therefore the resulting Iq commencement time and rise time calculations will differ as well. The NER specifically states that the positive sequence current must be used for both the commencement and rise time calculations.
gridmo explicitly calculates the positive sequence Ipoc for balanced faults, as well as unbalanced faults.
The Analysis Nodes within this template assume Automatic Access Standards (AAS). However, we note that S5.2.5.5 is frequently a Negotiated Access Standard (NAS) based on the following:
- Achieving the AAS 4% (LVRT) and 6% (HVRT) reactive current gains may result in unstable operation (LVRT/HVRT flag retriggering) under low SCR conditions.
- Achieving the AAS 10 ms commencement time and 40 ms rise time requirements for reactive current may result in unstable performance (LVRT/HVRT flag retriggering) under very low SCR conditions.
- Achieving the AAS 100 ms active power recovery time after a fault may not be achievable for large generating systems under low SCR conditions.
Confirm voltage disturbance values used to trigger LVRT and HVRT for FRT transition band tests
You may need to manually adjust the loop variables l_test_vdip and l_test_vrise within Node 1588 to ensure the following test methodology:
- The voltage dips (
l_test_vdip) low enough under the given SCR condition to trigger LVRT mode in your generating system - without tripping the generator; and - The voltage rises (
l_test_vrise) high enough under the given SCR condition to trigger HVRT mode in your generating system - without tripping the generator.
This template sets the generator to fixed reactive power control.
Alternate Iq injection curves
For Iq injection curve tests with an undervoltage event, a fault is used to create the disturbance. This methodology helps to avoid using a Thévenin equivalent voltage source playback for very low voltage dips (e.g. 10%) which has been known to cause unrealistic and undesirable generating systems responses.
For simulations involving an overvoltage event, the voltage disturbance is applied through a voltage playback rather than by switching a capacitor. In some cases, switching a capacitor can introduce oscillations in the Iq signal due to interactions between the plant and the capacitor used to create the disturbance. This is undesirable for assessing the Iq injection curve, as the objective is to analyse the settled Iq response, which becomes difficult when high‑frequency oscillations are present. Therefore, voltage playback is used for the overvoltage events.
This approach is appropriate for this assessment because we are not monitoring Iq commencement or settling time, both of which vary with network SCR. In this assessment, only the settled Iq value is recorded, and this parameter is not dependent on the network SCR, which allows use of the voltage playback command.
There are three alternatives for Iq injection curves:
- ΔIq v.s. V
- ΔIq v.s. ΔV
- Iq v.s. V
Assessment of S5.2.5.5A Iq injection amount is specified in the NER as the gradient of the ΔIq/ΔV curve. Given, the initial voltage is always the same in the test, the gradient of the ΔIq/V curve may also be used, as shown below.
- gradient = [ΔIq2 - ΔIq1] / [ΔV2 - ΔV1], where ΔV = Vfinal - Vinitial
- gradient = [ΔIq2 - ΔIq1] / [(Vfinal2 - Vinitial) - (Vfinal1 - Vinitial)]
- gradient = [ΔIq2 - ΔIq1] / [Vfinal2 - Vfinal1]
However, the initial Iq is not always the same and therefore the gradient of the Iq v.s. V curve may not be used.
S5.2.5.6 Quality of electricity generated and continuous uninterrupted operation
The purpose of S5.2.5.6 is to confirm that your generating system does not disconnect as a result of specified voltage fluctuation, harmonic voltage distortion and voltage unbalance levels.
We don't currently provide tests for S5.2.5.6. Additionally, compliance is often demonstrated via product information obtained via your OEM.
S5.2.5.7 Partial load rejection
The purpose of S5.2.5.7 is to confirm the ability of your generating system to maintain continuous uninterrupted operation during and following a particular power system load reduction event or a separation event with an equivalent impact.
- If your generating system is comprised of only grid-following asynchronous plant, then you could instead propose compliance with Section S5.2.5.7 via demonstrating compliance with Section S5.2.5.3 of the guidelines. Specifically, you could assert that any system separation event, regardless of load reduction of pre-disturbance level cannot exceed the minimum frequency band and ROCOF as per S5.2.5.3.
- However - if you have a synchronous plant or grid-forming inverters in your generating system, the inertia of your generating system may need to be considered in your generating system's ability to maintain continuous uninterrupted operation during a partial load rejection event.
S5.2.5.7 is only relevant if your generating system has synchronous generating unit(s) and is either:
- Mainland: ≥ 30 MW/MVA; or
- Tasmania: ≥ 7.2 MW/MVA (i.e. 5% x 144 MW).
See S5.2.5.7(a).
The template includes the ability to playback the network load reduction event into a SMIB model. This is completed by recording the voltage, frequency and angle response at the proposed connection point in the network case where your generating system has not yet been integrated and playing this back to your PSS®E and PSCAD™ SMIB generating system models.
Creating a load reduction event
If you are proposing to complete a partial load rejection test using a network case, you will need to provide a PSS®E Dynamic model of the NEM (colloquially known as an 'OPDMS snapshot' in the industry). We do not provide these snapshots. You will have to provide your own pre-tuned dynamic base cases for these tests.
Once you have your NEM snapshot, you can complete the following steps to modify the template to complete a partial load rejection test on a network case:
- In the
PSS®E DynamicNodes:- Special for S5.2.5.7 - you need to provide an event, using either a
SET, LINE=, STATUS=OUT, AT=command or similar, to actually create the partial load rejection event in the network case.
- Special for S5.2.5.7 - you need to provide an event, using either a
S5.2.5.8 Protection of generating systems from power system disturbances
The purpose of S5.2.5.8 is to confirm the generating system's protection response to a variety of power system disturbances.
S5.2.5.8 is only relevant if your generating system is either:
- Mainland: ≥ 30 MW/MVA; or
- Tasmania: ≥ 7.2 MW/MVA (i.e. 5% x 144 MW).
See S5.2.5.8(a00)(2).
- Tests are conducted using a playback generator with infinite inertia.
- All frequency 'steps' are completed at a 4Hz/s ramp rate.
We've assumed that tests to assess compliance with S5.2.5.8(a2) - do not disconnect within 20 milliseconds - are sufficiently assessed by the tests in S5.2.5.4 of this template. Bespoke tests to check that the generating system does not trip for a 20 millisecond over-voltage event are therefore not provided in this template.
It's unclear to us if S5.2.5.8(b6) - Voltage angle change ride-through tests- is applicable for all generating systems, or just those which are ≥30 MVA/MW as per S5.2.5.8(a00)(2). We've assumed that this test applies to all generating systems, as this requirement used to be part of S5.2.5.16 before it was deleted as part of AEMC ERC0393.
Over-frequency response
S5.2.5.8 makes references to the term, "extreme frequency excursion tolerance limits" whose value is provided in the AEMC | Frequency Operating Standard | Effective 9 October 2023. To determine that your generating system meets its requirement, you must choose a frequency ride-through SMIB playback test depending on your relevant frequency operating standard. Several common operating standards have been provided below. Copy and paste the chosen frequency operating standard into the PSS®E Dynamic and PSCAD™ Node SMIB frequency playback fields in all Nodes connected to Start Node 2812.
The "System restoration - Mainland" option is chosen by default in the template since because it represents the most difficult frequency ride through disturbances for the majority of projects (i.e. on the mainland).
- Normal - Mainland
- Island - Tasmania
- System restoration - Mainland [Default]
- CWO REZ
0,          50
5,          50
5.375,      51.5
And set loop variable l_start_time inside Loop: Start Node 2812 to 5.375.
0,          50
5,          50
6.125,      54.5
And set loop variable l_start_time inside Loop: Start Node 2812 to 6.125.
0,          50
5,          50
5.375,      51.5
And set loop variable l_start_time inside Loop: Start Node 2812 to 5.375.
0,          50
5,          50
5.375,      51.5
And set loop variable l_start_time inside Loop: Start Node 2812 to 5.375.
Choose voltage phase angle shift based on your generator's location
Choose a voltage phase angle shift depending on your relevant GPS requirements. Common requirements have been provided below. Copy and paste this text into the SMIB angle playback fields for the following Nodes:
- PSS®E Dynamic Nodes
2840and2845 - PSCAD™ Node
2844
- Normal
- CWO REZ
0,          0
5,          20
15,         0
25,         -20
35,         0
45,         0
0,          0
5,          30
15,         0
25,         -30
35,         0
45,         0
ERC0393 deleted S5.2.5.16 and the requirement to not disconnect under phase angle changes was moved into S5.2.5.8(b6).
S5.2.5.9 Protection systems that impact on power system security
The purpose of S5.2.5.9 is to confirm that your generating system has adequate protection systems.
We don't currently provide tests for S5.2.5.9. Additionally, compliance is often demonstrated via design reports.
S5.2.5.10 Protection to trip plant for unstable operation
The purpose of S5.2.5.10 is to confirm that your generating system has adequate protection systems.
We don't currently provide tests for S5.2.5.10. Additionally, compliance is often demonstrated via design reports.
S5.2.5.11 Frequency control
The purpose of S5.2.5.11 is to confirm the generating system's active power response to power system frequency changes. The control system response is tested to assess:
- the value to which the active power is changed as part of a frequency response mode; and
- that it is adequately damped.
- Only SMIB studies have been completed. Network-wide studies may be added to further demonstrate that the response is adequately damped.
- Frequency disturbances used to create the P(f) droop curve are completed at a 4Hz/s ramp rate.
Step 1 - P(f) droop curve | Choose frequency steps simulation time
Choose the frequency steps simulation time in the "P(f) droop curve" tests which is sufficient for your generating system to settle. This simulation time will depend on your ramp up and ramp down control limits (e.g. expressed in MW/sec). If required, edit the simulation time of the relevant PSS®E Dynamic, PSCAD™ and Plot Nodes.
Step 2 - Select source energy
For the UF and UF disturbance tests, select source energy values which correspond to 50% and 5%. In the relevant Loop: Start Nodes, edit the following Loop Variables: l_test_se_avail_pscad and l_test_se_avail_psse.
Step 3 - Choose active power control system ramp rate
For the "Freq step during P ramp" tests, a frequency step occurs during an active power ramp. This test is to confirm the generating system's "output [is] the summation of the AGC setpoint and the PFR Settings" in accordance with section 2.3.1 of AEMO | Primary Frequency Response Requirements | Effective 8 May 2023. You may need to reduce the active power control system ramp rate to ≈ 0.02 [p.u./s] to ensure the frequency step occurs during the active power ramp.
S5.2.5.12 Impact on network capability
The purpose of S5.2.5.12 is to confirm the extent to which your generating system impacts inter-regional and intra-regional network capability.
The assessment is divided into two parts:
- Static studies: Static studies may be used to assess thermal limits and voltage stability. Please refer to our template which addresses these requirements: Static studies.
- Dynamic studies: Dynamic studies are completed where faults are applied on a network case where the generating system is explicitly modelled and modelled as a negative load. The responses from both representations of the generating system are compared.
We don't currently provide tests for S5.2.5.12, though this is typically completed using a combination of:
- Static studies template.
- The faults assessed in S5.2.5.5 above.
S5.2.5.13 Voltage and reactive power control
The purpose of S5.2.5.13 is to confirm the capability of your generating system's reactive power control system. In accordance with S5.2.5.13(b)(2A), you must choose from one of the following control modes as your primary control mode (as instructed by your NSP) and one of the following as your secondary control mode:
- Voltage control
- Reactive power control
- Power factor control
- Table S5.2.1 - Row 1: The tests required as per the first row of Table S5.2.1 - a voltage setpoint change with the synchronous machine(s) not synchronised - are currently not included in this template.
- Table S5.2.1 - Maximum rise time: We have assumed that rise time requirements only apply to voltage disturbances, not setpoint changes. The Table column header is clear for settling time, but not rise time. We have made this assumption because the rise time content only refers to "2-5% voltage disturbance" and not "5% setpoint change".
- Table S5.2.1: When in reactive power and/or power factor control modes, 2-5% voltage disturbances (i.e. Vgrid steps) will not typically cause the limiting device to operate since the target value is independent of the grid voltage. Therefore, such tests are not included by default. Some generating systems may need to perform these tests (e.g. synchronous generators whose excitation system reactive power/power factor control mode is a slow control loop around a fast-acting voltage control inner loop - whereby for sudden voltage disturbances the control system will behave like it is in voltage control mode and therefore may hit UEL/OEL limiters). For such generating systems, please feel free to contact gridmo support to get help modifying the template accordingly.
- Several control modes have variable settling time requirements for setpoint changes based on whether the response "overshoots the sustained change or response is oscillatory" (i.e. "Voltage as secondary", "Power factor as primary", "Reactive power as primary" and "Reactive power as secondary"). However, there are not the same variable settling time requirements for voltage disturbances. Given control systems typically have similar response times for equivalent setpoint changes and voltage disturbances, we assume that most generating systems will not be utilising the longer 30 second settling time allowance. Therefore, the template has been configured by default to assess the shorter settling time requirement, irrespective of whether the response overshoots or is oscillatory. Some generating systems may utilise these longer settling time allowances (e.g. generating systems which have different control gains or ramp rate limits on the reference setpoint input signals versus the overarching control system error summing junction). For such generating systems, please feel free to contact gridmo support to get help modifying the template accordingly.
- Table S5.2.1 Row 5 (i.e. "Power factor as secondary") appears to have no rise or settling time performance requirements for power factor reference step changes. We note this is abnormal compared to other sections of the same table. However, we assume that this is not an error and therefore no
RISE_TIMEorSETTLING_TIMECommands have been included for PFref tests.
Choosing your primary and secondary control modes
S5.2.5.13(b)(2A) states that your generating system must:
- Operate in voltage (droop) control mode, unless your NSP says otherwise; and
- Operate in one additional control mode, either power factor control mode or reactive power control mode.
We're unsure if the secondary control mode is selected by you, or elected by your NSP. Power factor control has fewer performance requirements than reactive power control, however reactive power control may be required for compliance with AEMO's VAr dispatch system (if applicable).
Once you've identified the control modes you are proposing, disable the flows in the template which are not required. Only two of the below flows should be enabled:
- Node
1493: Primary - Voltage control - Node
2249: Primary - Reactive power control - Node
1808: Primary - Power factor control - Node
3243: Secondary - Voltage control - Node
2971: Secondary - Reactive power control - Node
2451: Secondary - Power factor control
By default, we have chosen the following combination of control modes:
- Primary control mode: Voltage control
- Secondary control mode: Reactive power control
This selection is most common for large plants because NSPs will want them to help regulate voltage during normal operation and may want to set the VAr dispatch during abnormal operating conditions in accordance with AEMO's VAr dispatch system. However, there are several instances where generating systems may have different control modes (e.g. NSPs will most likely want smaller generating systems in distribution networks to operate in power factor control during normal operation).
Q(V) droop curve | Choose grid voltage steps simulation time
Disable Start Node 2004 and skip this step if your generating system is not operating in voltage control mode.
Choose the grid voltage steps simulation time in the "Q(V) droop curve" tests which is sufficient for your generating system to settle. This simulation time will depend on your reactive power control system gains as well as your ramp up and ramp down control limits (e.g. expressed in MVAr/sec). If required, edit the simulation time of the relevant PSS®E Dynamic, PSCAD™ and Plot Nodes.
Choosing PFref and/or Qref values in setpoint change tests
Choose PFref and Qref values which correspond to a "...a setpoint change equivalent to at least half of the reactive power range (absorbing to injecting) established under clause S5.2.5.1" (e.g. 50% × 0.395 × rated active power for S5.2.5.1 AAS). Note that PFref values may be in different units depending on your OEM model (e.g. radians, degrees, unitless). If required, edit the PFref and Qref Commands in the relevant PSS®E Dynamic and PSCAD™ Nodes.
Update the step values in the PSS®E Dynamic and PSCAD™ Nodes connected to the following Start Nodes. Note not all of these Nodes may be enabled based on your generating system's proposed control modes:
- Node
2249: Primary - Reactive power control - Node
1808: Primary - Power factor control - Node
2971: Secondary - Reactive power control - Node
2451: Secondary - Power factor control
To achieve the same reactive power step size, the PFref step value will need to change depending on the initial active power.
Choosing the size of shunt reactive element to create a voltage disturbance in network studies
For network grid voltage steps, choose the size of a shunt reactive element to be inserted at the connection point to create ±5% steps.
We've assumed that studies on a network case are only required for your S5.2.5.13 primary control mode, which in most cases is voltage control. Please contact us if you need these tests for other control modes (e.g. reactive power or power factor) and we'll provide a modified Run for these alternative control modes.
S5.2.5.14 Active power control
The purpose of S5.2.5.14 is to confirm the capability of your generating system's active power control system.
Choosing spacing between active power steps
Choose the spacing between active power steps which is sufficient for your generating system to reach each target set point. This spacing will depend on your ramp up and ramp down control limits (e.g. expressed in MW/sec). If required, edit the following Commands:
- PSS®E
- PSCAD™
$s_psse_ds_p_command, AT=5, VAL=0.5
$s_psse_ds_p_command, AT=15, VAL=0.05
$s_psse_ds_p_command, AT=25, VAL=1
$s_pscad_p_command,  AT=5, VAL=0.5
$s_pscad_p_command,  AT=15, VAL=0.05
$s_pscad_p_command,  AT=25, VAL=1
S5.2.5.15 Short circuit ratio
The purpose of S5.2.5.15 is to confirm the ability of your generating system to operate stably and remain connected at a specified low short circuit ratio.
S5.2.5.15 states that this requirement should be "...assessed in accordance with the methodology prescribed in the system strength impact assessment guidelines". Please refer to our template which addresses these guidelines: AEMO System Strength Impact Assessment Guidelines (Appendix B).
Assumptions
- Generally, Automatic Access Standard (AAS) is assumed for all tests and Analysis Nodes within the template.
- Some GPS tests require a PSS®E model of the NEM (colloquially known as an 'OPDMS snapshot' in the industry). We do not provide these snapshots. You will have to provide your own pre-tuned dynamic base cases for these tests.
- Network frequency dependency is by default disabled, but can be enabled if desired.
- For tests which are confirming parameters which only affect a final settled value (e.g. Q(V) droop characteristic parameters, P(f) droop characteristic parameters, and Iq(V) droop characteristic parameters), these are often conducted at infinite SCR to simplify the test methodology and interpretation of results. For tests which are confirming parameters which may affect transient dynamic performance (e.g. Kp gain for the Iq(V) response), these are conducted using site-specific SCR values.
Sources
- AEMC | National Electricity Rules | Version 234 | 21 August 2025
- AEMC | Final Determination ERC0393 | 22 May 2025
- AEMC | Frequency Operating Standard | Effective 9 October 2023
- AEMO | Primary Frequency Response Requirements | Effective 8 May 2023
- AEMO | Template for proposed Generator or Integrated Resource Provider Performance Standards | 15 March 2023
- AEMO | Access Standard Assessment Guide | 31 January 2019
- AEMO | Power System Model Guidelines | Version 2 | July 2023
- EnergyCo | Template for Performance Standards for CWO REZ
Revision history
Version 5 | 3 July 2026
Fixed- S5.2.5.5A Balanced disturbances Iq injection curve - end values for Vpoc and Iqpoc set to the median of the final 5% of values during the fault rather than the absolute last value before fault end.
- Units for Ppoc fixed in Plot Node
3176and3183to be MW rather than p.u. - Plot Node 1336: Updated error bands which were missing, "TAT=120".
Version 4 | 24 June 2026
Improvements- To support the growing complexity of projects and grid codes, we created a new version of the template which fully utilizes the latest features in gridmo such as:
- Global variables in loops for easier setpoint configuration
- Multiline partial command Global Variables
- Global subplots
- Operating conditions
- PSCAD™ only initialization
From this version onwards, the legacy template library version of this template is no longer maintained.
- S5.2.5.1: Assessment begins from Pmin rather than P = 0 p.u.
- Custom label for commencement time added to plots. Plot Nodes
3382,3149,3180,3200,3173. - S5.2.5.5 network studies - major update. New global variables for easier setpoint configuration.
- S5.2.5.7 network studies - major update. New global variables for easier setpoint configuration.
- S5.2.5.13 network studies - major update. New global variables for easier setpoint configuration.
Version 3 | 9 March 2026
Fixed- S5.2.5.5: Network fault performance, commencement time methodology updated to begin at fault inception rather than at initiating condition. Commencement time requirement set to initiating condition + 10 ms. Rise time calculation also updated to begin at fault inception, not at initiating condition. Updated Nodes
3149,3150,3151,3166,3167,3168. - S5.2.5.5A: Balanced and Unbalanced voltage disturbances, commencement time methodology updated to begin at fault inception rather than at initiating condition. Commencement time requirement set to initiating condition + 10 ms. Rise time calculation also updated to begin at fault inception, not at initiating condition. Updated Nodes
3173,3174,3175,3180,3181,3182,3200,3201,32022687,3197. Additional plots added to show Iq commencement time margin to visualise compliance. - S5.2.5.5A: FRT transition bands methodology updated to set the generating system to fixed reactive power control. Updates Nodes
2535,2530,2531,2535. - S5.2.5.5A: Unbalanced voltage disturbances, fixed typos for Analysis Nodes descriptions
3204,3199. - S5.2.5.5A: Balanced disturbances - Iq injection curve, Node
2688. Changed the assessment methodology for overvoltage events to be via voltage playback rather than via switched capacitor. - S5.2.5.5A: Balanced disturbances - Iq injection curve, Node
2688. In PSS®E, the grid voltage playback occurs one timestep later than in PSCAD™, reflecting how PSS®E applies the playback signal. - S5.2.5.5A: Rise time requirement and active power recovery requirement lines have been added to their respective nodes. Updated Nodes
3175,3176,3182,3183,3202,3203. - S5.2.5.5A: Balanced voltage disturbance calculations and Iq rise and commencement calculations, are now completed using Iqpoc positive sequence rather than Iqpoc total. Updated Nodes
3173,3175,3180,3182. - S5.2.5.13 - In PSS®E, the grid voltage playback occurs one timestep later than in PSCAD™, reflecting how PSS®E applies the playback signal. Nodes
1516,1520,2020,2022,2243,2245,1733,1735,3252,3255,3269,3270,3289,3291,3216,3318updated.
Version 2 | 27 November 2025
Fixed- S5.2.5.4: Updated Analysis Node
2637to be a manual check for Qpoc response since the correct response depends on the default Q-loop control mode. - S5.2.5.5A: Updated Iq injection curve scatter plots (Plot Nodes
2585and3216) such that the green AAS shading flattens out at 1 [p.u.] such that it doesn’t imply that Iq > 1 [p.u.] is required to meet AAS. - S5.2.5.5A: Updated unbalanced Iq injection curve scatter plot (Plot Node
3216) to remove HVRT gradient calculation since the template does not yet contain unbalanced overvoltage disturbances. - S5.2.5.5A: Fixed typo in Analysis Node
3222to correctly refer to phase c instead of b.
Version 1 | 30 June 2025
- First release