Template: Powerlink inverter based renewable plant GPS study requirements
Template version: v5
Country:

AU
Software required:
Source: Powerlink | Inverter Based Renewable Plant: GPS Connection Study Process and Expectations | Version 1.3 | January 2024

How to add this template to your project
- From within your gridmo project, open the flow dropdown and select 'Add flow'.
- Select the template you want to use and click 'Add to project'.

Background
Powerlink is the Transmission Network Service Provider in Queensland, Australia and plays a key role in generator connections. In an effort to help proponents in the connection process for inverter based renewable generating systems, they published a document outlining the "GPS Connection Study Process and Expectations". This document is similar to the AEMO document, AEMO | Access Standard Assessment Guide | 31 January 2019 whereby it provides guidance on the tests required to demonstrate generating system performance. However, there are several tests described in this Powerlink document which are either different or additional to those provided in the NER Chapter 5 Typical Generator Performance Standards (GPS) template. This template includes those different and additional tests.
This template only includes tests which are either which are either different or additional to those provided in the NER Chapter 5 Typical Generator Performance Standards (GPS) template. Therefore, this template should be used in conjunction with the NER Chapter 5 Typical Generator Performance Standards (GPS) template.
smiby v24 or greater is required to run this template. The latest version of smiby can be downloaded here.
Reference
Common assumptions
- Generally, Automatic Access Standard (AAS) is assumed for all tests and Analysis Nodes within the template.
2.1.2 Model aggregation
What is model aggregation
Model aggregation is the method of combining multiple generators into a smaller number of mathematically equivalent generators. Aggregated generator models are commonly used as they have lower computational complexity and are simpler to understand compared to a disaggregated model.
For example, inverters used in a typical solar farm have a nameplate capacity between ~2 and ~5 MVA per inverter. A solar farm therefore requires tens or hundreds of these inverters depending on its size. These inverters are commonly configured in an arrangement similar to the below (multiple inverters connecting onto a single common feeder, known as a 'collector cable', with multiple collector cables in parallel).
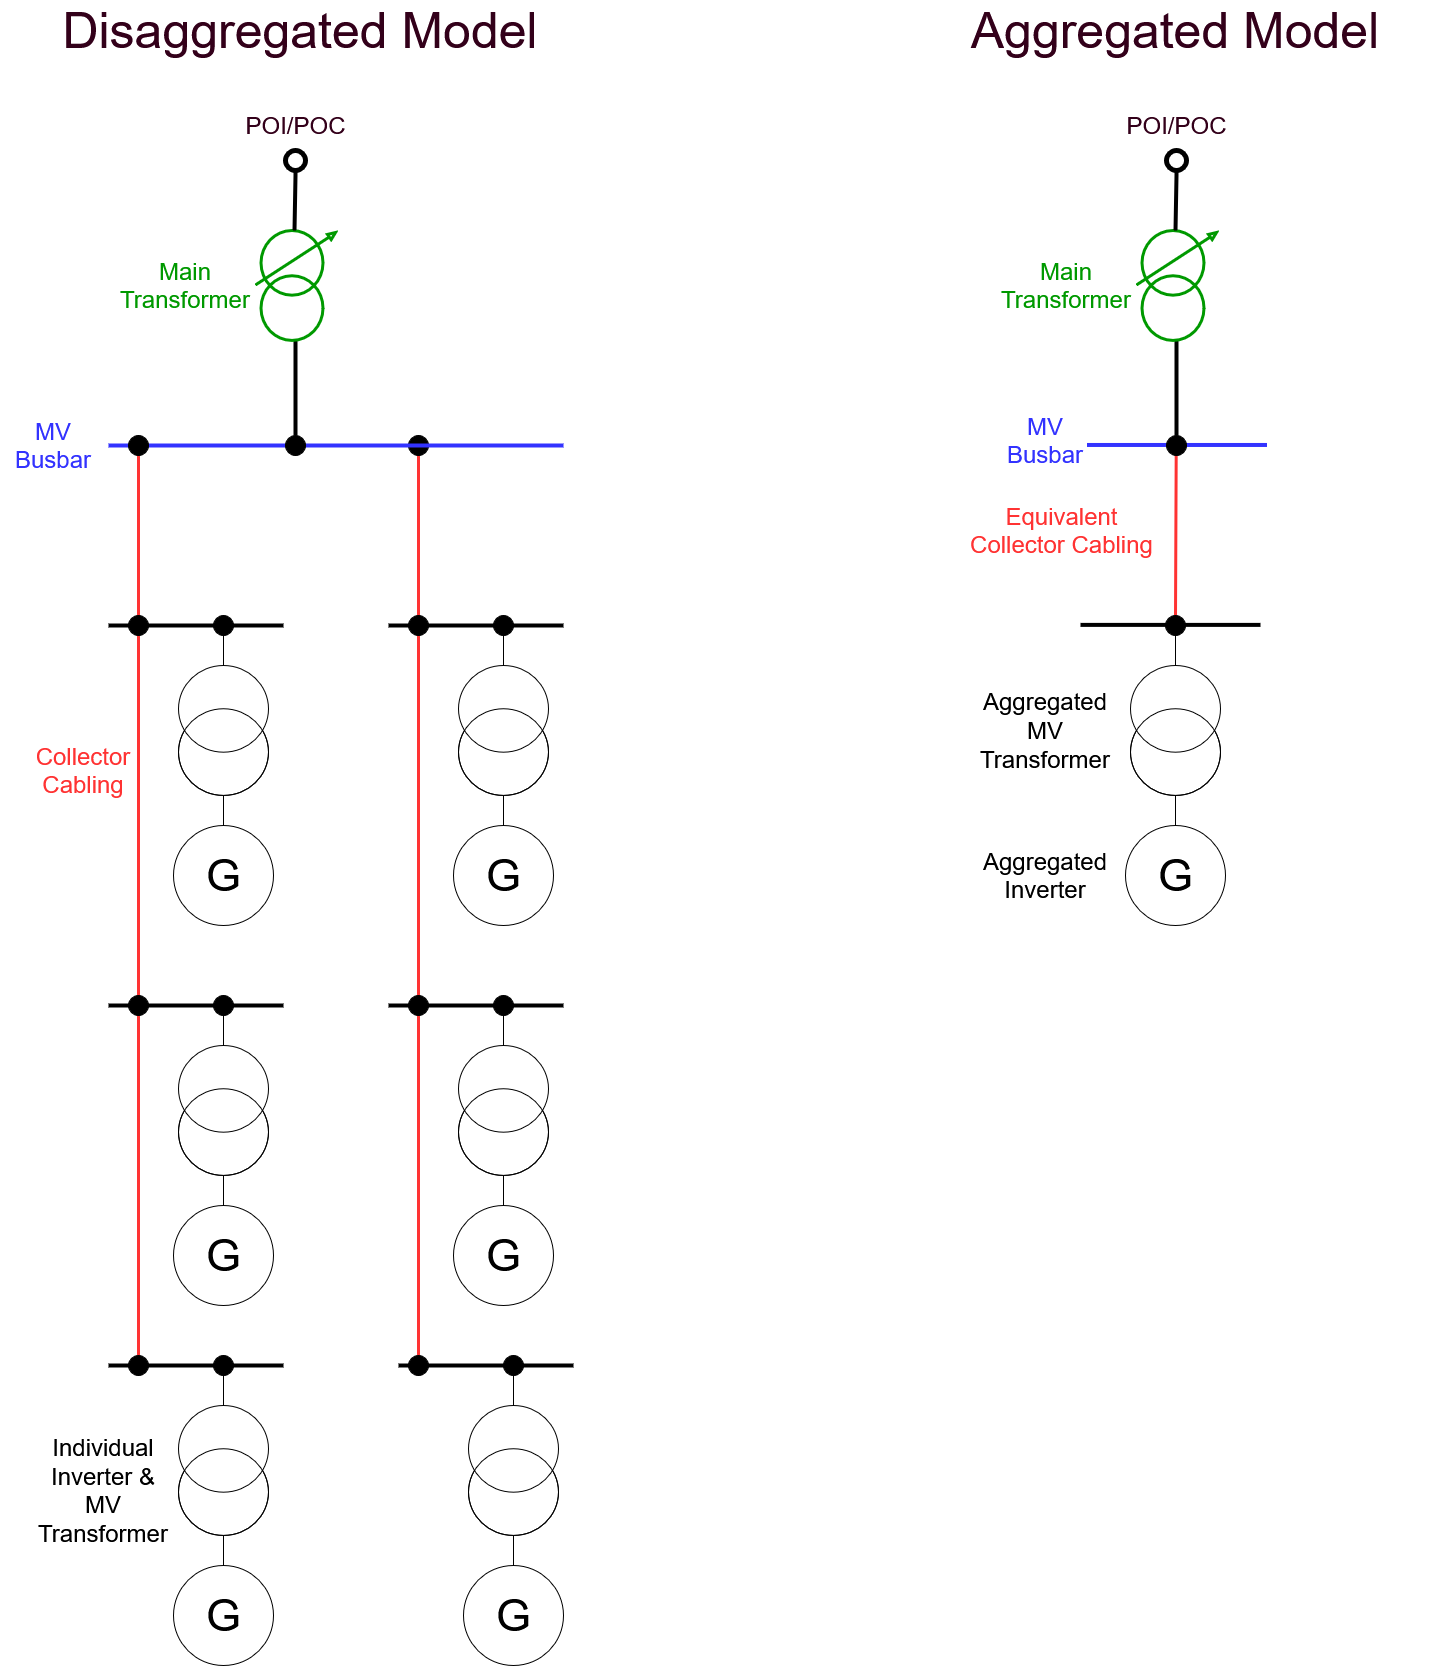
Comparison of disaggregated and aggregated solar farm models
The disaggregated model (left) is a full model of the solar farm, with each inverter and collector cable section modelled separately.
The aggregated model (right) is the mathematical simplification. Note in this model, the impedance of the collector cabling does not represent any single cable in the actual plant, it is a mathematical representation of the losses within the entire collector cabling system.
For projects in the Australian NEM, the disaggregated model is normally created in PowerFactory, as:
- Harmonic emission and amplification studies (S5.2.5.2 of the NER) require a detailed model of the generating system. This is because the full arrangement of the collector cabling is required to get an accurate RLC resonance profile of the balance of plant, and
- If required, unconstrained PQ capability curves (S5.2.5.1 of the NER) should be completed with a disaggregated model of the generating system, especially for inverter based plant, so terminal level voltage limits can be enforced. PowerFactory has a built-in PQ capability macro which can assist with the generation of these curves.
Creating disaggregated model
We don't yet have an automated method of creating a disaggregated model in gridmo - however we can provide some notes on the common process:
- Create a PowerFactory model of the disaggregated generator given the generating system design (location of inverters, collector cabling lengths and cable sizes, transformer details, etc).
- We recommend you add station controllers for active and reactive power into your disaggregated model, as this simplifies benchmarking with the PSS®E and PSCAD™ aggregated models.
- Use an aggregation methodology to calculate the equivalent collector cabling, equivalent transformer(s) and equivalent generators. A common methodology used is NREL's Method of Equivalencing for a Large Wind Power Plant with Multiple Turbine Representation.
It is common at the model aggregation stage to use typical or assumed values (cable sizes, lengths, transformer characteristics etc.)
However, as the design progresses these assumed values should be progressively updated to align with the actual proposed plant.
Creating aggregated model
We don't yet have an automated method of creating an aggregated model in gridmo - however we can provide some notes on the common process:
- Modify the supplied PSS®E and PSCAD™ models of the aggregated generator provided by your OEM to align with the aggregation values calculated above.
- Be careful of unit conversions between software packages when setting up the aggregated models. For example, transformer load losses in PSS®E are in W, whilst in PSCAD™ they are typically in per unit on transformer base (in MVA).
Purpose
This Run completes a benchmark between:
- An aggregated PSS®E model
- An aggregated PSCAD™ model
- A disaggregated PowerFactory model [Optional - disabled by default]
Powerlink's requirements state that the aggregation validation tests should be completed at several active power and reactive power values - with the additional requirement that the point of connection active and reactive power limiters are removed to confirm that inverter limiters match between the models.
The latest version of the Powerlink document states that the minimum active power for these tests shall be 0.01 pu of the plant maximum active power for non-BESS plant and 0 MW for BESS, however feedback received from Powerlink has stated that 0 MW is the preferred minimum active power for the test for all generator types, not just BESS.
The Powerlink document is not clear what Pmax, Qmax and Qmin refer to in this context.
As active and reactive limiters are the connection point are specifically requested to be disabled, we've assumed that Pmax, Qmax and Qmin refer to the maximum unconstrained capability of the plant (e.g. the inverter capability limits measured at the point of connection, considering losses in the plant with reactive support if any).
Based on this assumption, this Run has been configured to make extremely large Pref and Qref requests of 2 p.u. for Pmax, Qmax and Qmin values. These values are selected deliberately to be beyond the capability of your generating system. Your generator is not expected to react these target values. However, the inverter limiters in the disaggregated model should match that of the aggregated model, meaning the values at the point of connection should still align, even if they are not equal to the values requested.
Given we subject the aggregated model and disaggregated model to the following:
- Same short circuit ratio (SCR) and reactance to resistance ratio (X/R) at the connection point - we typically use infinite SCR for simplicity.
- Same voltage at the connection point - which for infinite SCR is the same as the infinite bus voltage.
- Same active and reactive power target (e.g. Pref and Qref) at the connection point.
Then we expect the following:
| Result | Location | Notes |
|---|---|---|
| Voltage | Connection point | Matches identically (as infinite SCR and same Vthev between models). |
| Voltage | MV terminal | Average of all MV terminal voltages in the disaggregated model matches well with the aggregated model. |
| Voltage | Inverter terminal | Average of all inverter terminal voltages in the disaggregated model matches well with the aggregated model. |
| P and Q | Connection point | Match identically (as same reference target, even if less than requested value). |
| P and Q | MV terminal | Average of all MV terminal active and reactive powers in the disaggregated model, scaled by number of inverters, matches well with the aggregated model. |
| P and Q | Inverter terminal | Average of all inverter terminal active and reactive powers in the disaggregated model, scaled by number of inverters, matches well with the aggregated model. |
| Q | Reactive plant terminals | Depending on how it is modelled, either average of all reactive power contributions matches well with the aggregated model or matches identically if a single reactive plant is present. |
| Tap ratio | Main transformer | Match identically - as either tap ratio is imported from one software package into the other(s) or the models should have the same OLTC VRR settings. |
The purpose of this test is to confirm the above is true.
The Table Node in this Run is configured with common values above which are exported to an Excel file as evidence of accurate aggregation.
You will need to make changes to all Nodes in the Model Aggregation Run based on your specific plant configuration and the values you wish to use as evidence of accurate aggregation.
You may need to export additional values from the PSCAD™ Node's Plot such as:
- Main transformer tap position.
- State (e.g. in/out or shunt step) of any static reactive plant.
- Reactive power injection of any dynamic reactive plant.
Why we recommend you initialise from PSCAD™
We've configured our template to initialise the PSS®E aggregated static model and PowerFactory disaggregated static model using results from a PSCAD™ model, because:
- PSCAD™ natively ramps from initial values of P=Q=0 to the target value.
- PSCAD™ models typically have tap changers with dynamic voltage regulation capability, including faster than normal tapping during initialisation.
- For this test, initialising using PSS®E is unsuitable as:
- PSS®E Static has limited native reactive power capability support, especially for sources which have voltage-dependent PQ capability. The internal
GCAProutine can partly assist, but in our experience it is uncommon for OEMs to provide GCAP-compatible capability curves in the required format for PSS®E. - It is possible to initialise a PSS®E Dynamic model outside of its capability. Whilst the model may raise an initial conditions suspect warning, it wont (typically, in our experience) ramp down to be within its capability. Hence plant must be configured to start at P=Q=0 and ramp to the target value, which will require additional configuration (such as adding a
OLTC1Tmodel into the PSS®E dynamic model to change the main transformer tap position).
- PSS®E Static has limited native reactive power capability support, especially for sources which have voltage-dependent PQ capability. The internal
- For this test, initialising using the PowerFactory disaggregated model is unsuitable as:
- Not all gridmo users have a PowerFactory licence (as it is used for only a small subset of tests for Australian NEM grid connection projects) - therefore, if you do not have a PowerFactory licence and this Run was using PowerFactory to initialise, it would require substantial modification of this Template.
2.1.3 Performance of reactive current in fault conditions
The purpose of 2.1.3 is to confirm your generating system's response during balanced and unbalanced disturbances.
- Balanced faults: For balanced fault performance and creation of Iq injection curve, see "[SMIB] S5.2.5.5: 2 - Fault performance" in the NER Chapter 5 Typical Generator Performance Standards (GPS) template.
- Unbalanced faults: For unbalanced faults, we have provided the tests in this template.
- This test loops through different Iq gains as the Powerlink requirements state that "as a minimum, a range of positive and negative sequence gains should be studied". It is assumed the intention of this test is to demonstrate that appropriate values for gains have been chosen for your project. Manually adjust the Loop Variables
l_gain_pos_iqandl_gain_neg_iqwithin Loop: Start Node. The gain values will be specific to your generating system model. - Section 2.1.3 imply that positive and negative sequence current injection should not "adversely affect Powerlink and other customers" by causing excessive voltage rise on unfaulted phases during unbalanced faults. It is unclear on what is deemed to be excessive. We have arbitrarily assumed that a voltage rise of > 0.05 [p.u.] is excessive in Analysis Node
1856. - We don't currently have the ability to create a box plot and have therefore displayed the data in a similar, but different way. If you would like a box plot, this can be completed by post-processing the Table Node data in Excel.
2.1.5 Plant controller function during and post fault
The purpose of 2.1.5 is to demonstrate your generating system's power plant controller performance during the following types of events:
- Part 1: A Thévenin equivalent source frequency disturbance applied during and continuing after a fault; and
- Part 2: A Thévenin equivalent source voltage disturbance applied during and continuing after a fault.
- A "moderately severe (ie: not shallow) fault" is represented by a 40% residual fault.
- A "moderately inductive initial operating point" is represented by an initial Qpoc value of
-0.2[p.u.] on Pbase. - All frequency disturbances are completed at a 4Hz/s ramp rate.
2.1.6 Oscillation rejection
Background
The purpose of 2.1.6 is to demonstrate your generating system's does not amplify sub-synchronous oscillations present in the power system. Selection of control parameters (gains) for voltage and reactive power control modes is a trade-off between achieving rapid rise and settling times (which generally requires high gains) and minimising amplification of sub-synchronous oscillations (which generally requires low gains).
This test applies a voltage oscillation to the generating system's point of connection (using the VOLT_OSCIL command in the PSCAD™ Node). This test is completed at the system N-1 (minimum) SCR and X/R of the generating system.
The generator's control system will respond to the voltage oscillation depending on the control mode by:
- Attempting to maintain reactive power or power factor at the connection point (if in reactive power or power factor control mode), or
- By opposing the voltage oscillation (if in voltage control mode).
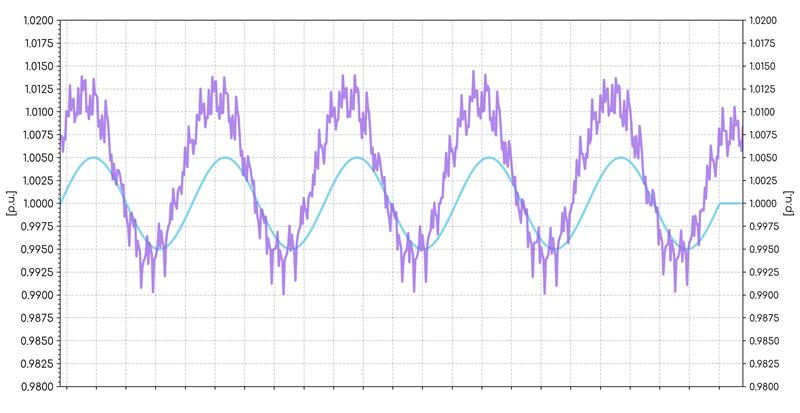
Example of an amplification of a subsynchronous oscillation. Point of connection voltage (in purple) has a greater maximum to minimum value compared to the ideal driving source (in blue).
To measure the impact of the generator's response to the voltage oscillation, the amplification factor is calculated at multiple test frequencies. The amplification factor at each frequency is defined as the ratio of:
- The magnitude of the voltage oscillation with the presence of the proposed generating system; to
- The magnitude of the voltage oscillation without the presence of the proposed generating system (i.e. the magnitude of the injected voltage oscillation).
An amplification factor greater than 1 means that the generating system is amplifying the injected voltage oscillation, whereas a value less than 1 means that the generating system is attenuating the injected voltage oscillation.
In this template, we have provided two methodologies to calculate the amplification factor - the 'engineering' methodology and the 'theoretical' methodology:
- Engineering methodology: The amplification factor considers the peak to peak values of Vpoc.
- Theoretical methodology [Powerlink default methodology]: The amplification factor only considers the oscillation magnitude at the frequency of the injected voltage oscillation signal. The impact of other induced frequencies are not considered.
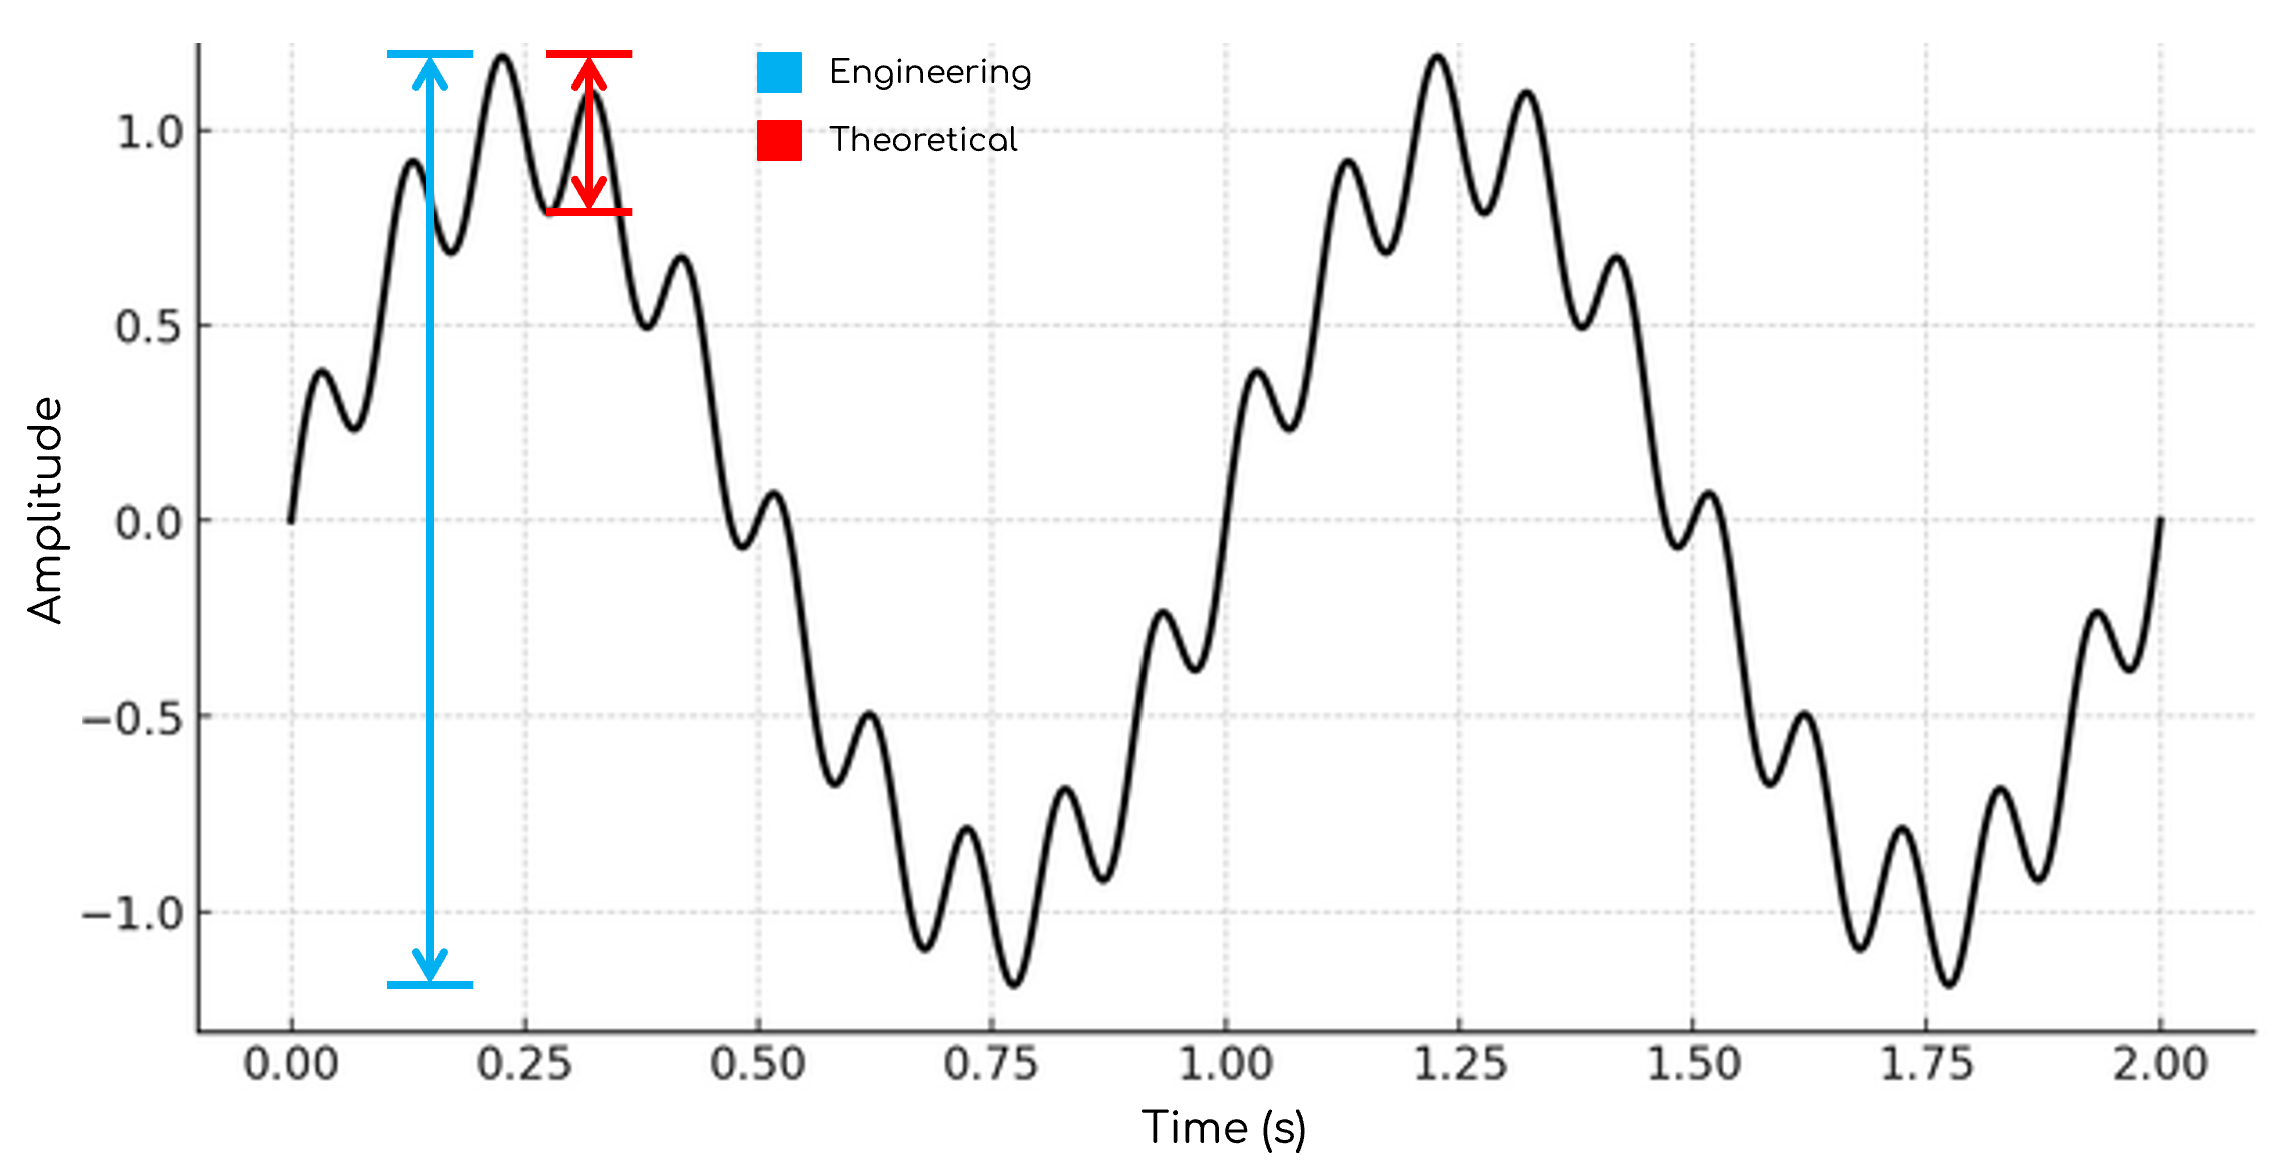
For some plant responses, the two methodologies can have very different results. Consider the following example:
- A 10 Hz voltage oscillation is injected. The plant attenuates the 10Hz oscillation very well.
- Unfortunately, the 10Hz oscillation induces a 1Hz voltage oscillation which has a large amplitude.
As shown in the image below, the 'engineering' methodology considers the peak to peak of the entire channel, irrespective of the injected oscillation frequency. Therefore, the amplification would be quite large. In contrast, the 'theoretical' methodology only considers the peak to peak of the injected oscillation frequency. Therefore, the amplification factor would be quite small.
We recommend using both methodologies in addition to reviewing the time series plots to gain a complete understanding of your generator's response to the voltage oscillation.
The Powerlink document references both the 'amplification factor' and 'attenuation factor' which are the reciprocal of each other. For consistency, we have standardised on calculating 'amplification factor' in this template.
Meter selection
Powerlink's document recommends the use of "analog" metering in PSCAD™ for this test with either a 0 or 20 ms smoothing time constant.
However, smiby instead uses higher sampling rate digital meters (with 1 kHz sampling rate). This is because:
- PSCAD™ do not recommend using 0 ms sampling rate as it can be very noisy.
- Using a non-zero smoothing rate still applies a 6th harmonic oscillation due to the REALP2 function in EMTDC.
This test can create inconsistent results if your PSCAD™ model has a large plot-step. gridmo will raise a warning if the plot-step is abnormally large (see here for details).
If you choose to not use smiby's built-in metering, you will need to modify the Run to have a second PSCAD™ Node with your generating system out of service but the voltage oscillation still present. It is important that the style of metering selected for this test is consistent for all studies and all meters.
S5.2.5.4 Generating system response to voltage disturbances
The purpose of S5.2.5.4 is to confirm the ability of your generating system to maintain continuous uninterrupted operation for particular voltages at the connection point.
Powerlink have included S5.2.5.1 and S5.2.5.5 assessment criteria within these S5.2.5.4 tests, whereby:
- "P and Q are not reduced" for tests where Vpoc varies within 0.9 - 1.1 [p.u.] is referring to compliance with S5.2.5.1(a); and
- "generating units can not remain stuck in FRT mode" for tests where Vpoc varies within 0.9 - 1.1 [p.u.] is referring to compliance with S5.2.5.5(g)(1).
- We have included these assessment criteria in the Analysis Nodes to ensure compliance with Powerlink requirements.
- Tests are conducted at infinite SCR and X/R.
- Tests are conducted using a playback generator with infinite inertia.
- Tests 1 - 12: Simulation length is 30 seconds which is assumed to be enough time for Ppoc and Qpoc to settle after the applied disturbance.
- Tests 5 - 6: V_Qmax and V_Qmin are assumed to be ≥ 1.0 [p.u.] for the Analysis Node. If either of these values are < 1.0 [p.u.], then the Analysis Node check should not apply since the applied Vpoc disturbance would be < 0.9 [p.u.] and the generating system would not longer be required to maintain Ppoc and Qpoc.
- Tests 13 - 16: Ride-through tests for each voltage range are chosen such that the time spent within that range includes any time spent in the more onerous ranges.
- Tests 3, 11, 15: BESS Pmin is given as 0 MW. Maximum charging mode will most likely be captured by the Pmax case in a different scenario configured in gridmo.
- S5.2.5.4(a)(1): "over 130% of normal voltage" is represented by 135%.
S5.2.5.5 Generating system response to disturbances following contingency events
The purpose of S5.2.5.5 is to confirm your generating system's response during and after disturbances. There are several parts of this performance standard.
Powerlink have specified one additional part beyond the tests outlined in NER Chapter 5 Typical Generator Performance Standards (GPS) template whereby, "A range of contingencies should be studied...Remote faults: on the transmission system, and slower remote faults on the nearby distribution system. These should cover scenarios where the generating systems is marginally within its fault ride through mode, marginally outside its fault ride through mode, and show performance when only one of plant controller and generating unit is in fault ride through mode." The following additional part has been added to meet this requirement.
- FRT transition faults | SMIB: Balanced voltage disturbances marginally inside/outside of FRT mode.
S5.2.5.7 Partial load rejection
The purpose of S5.2.5.7 is to confirm the ability of your generating system to maintain continuous uninterrupted operation during and following a particular power system load reduction event or a separation event with an equivalent impact. There are two test methodologies outlined by Powerlink:
- [Not currently supported] Place a load representing 30% of your generating systems rated active power at the connection point and trip this load.
- Model a power system load reduction event or a separation event with an equivalent impact in a PSS®E NEM OPDMS network case where your generating system has not yet been integrated. Record the voltage, frequency and angle response at the proposed connection point in the network case and play this back to your SMIB generating system.
Sources
- [1] Powerlink | Inverter Based Renewable Plant: GPS Connection Study Process and Expectations | Version 1.3 | January 2024 (not publicly available)
Revision history
Version 5 | 15 December 2025
Improvements- Added Action Nodes.
- Added new methodology for calculating amplification factor in Plot Node
1912and Table Node1911, based on the voltage magnitude of the injected frequency.
- Model aggregation: Removed comments about disabling inverter limiters - gridmo methodology only requires the PPC inverters to be disabled.
Version 4 | 23 April 2025
New- 2.1.2 Added background on model aggregation and expanded details on setup. Template now uses PSCAD™ to initialise PSS®E and PowerFactory Static Nodes.
- 2.1.3 Performance of Iq in fault conditions - Unbalanced: Modified test to allow for separate configuration of positive and negative sequence FRT gains, rather than a single gain value.
- 2.1.6 Oscillation rejection: Added amplification factor calculation within Table Nodes
1731and1829, expanded details on setup and background.
- 2.1.2 Model aggregation: Modified test to set Pmin = 0 rather than P = 0.01 p.u, as per Powerlink feedback.
- 2.1.5 Part 1 - Fault with frequency disturbance: Modified test methodology by setting the Thévenin equivalent source frequency disturbance to remain high at 50.5 Hz rather than returning to 50 Hz, as per Powerlink feedback.
- 2.1.5 Part 2 - Fault with voltage disturbance: Modified test to set reactive power target
l_qcmdto -0.2 p.u, as per Powerlink feedback. - 2.1.6 Oscillation rejection: Removed commands to increase the sampling frequency of Thévenin equivalent voltage source multimeter in smiby in Nodes
1427and1825. This is now handled automatically in smiby (v19 or greater) via theVOLT_OSCILcommand. - 2.1.6 Oscillation rejection: Removed alternative calculation methodology (using generator in and out of service) as was more computationally demanding with no additional benefit.
Version 3 (v1.4.19) | 24 December 2024
- Included additional test for S5.2.5.7 Partial load rejection.
Version 2 (v1.4.17) | 3 October 2024
- 2.1.5 Part 1 - Fault with frequency disturbance: The Thévenin equivalent source frequency disturbance methodology was changed so that it returns to 50 Hz, rather than remaining at 50.5 Hz.
Version 1 (v1.4.16.6) | 19 September 2024
- First release.